climate_indices库作者:詹姆斯·亚当斯
邮箱:monocongo@gmail.com
软件主页:https://www.drought.gov/software
github:https://github.com/monocongo/climate_indices
climate_indices库能够计算的指数如下:
SPI,Standardized Precipitation Index, utilizing both gamma and Pearson Type III distributions.
SPEI,Standardized Precipitation Evapotranspiration Index, utilizing both gamma and Pearson Type III distributions.
PET,Potential Evapotranspiration,
utilizing either Thornthwaite or Hargreaves equations.
PDSI,Palmer Drought Severity Index.
scPDSI,Self-calibrated Palmer Drought Severity Index.
PHDI,Palmer Hydrological Drought Index.
Z-Index,Palmer moisture anomaly index (Z-index).
PMDI,Palmer Modified Drought Index.
PNP,Percentage of Normal Precipitation.
本文以站点SPEI计算为例:
注:源代码作者信息暂匿名,CSDN:EWBA_GIS_RS_ER.
import numpy as npimport pandas as pdfrom climate_indices import indicesfrom climate_indices import computerootdir = r'F:/Rpython/lp36/data/SPEI_Cal/'tampa_file = rootdir + 'test/tampa.csv'outpath = rootdir + 'test/'lat = 27.96styr = 1900edyr = 2007tampa_data = pd.read_csv(tampa_file)pre_data = np.asarray(tampa_data['Pre']) tas_data = np.asarray(tampa_data['Tas']) pet_data = indices.pet(temperature_celsius=tas_data,latitude_degrees=lat,data_start_year=styr)spei = indices.spei(precips_mm=pre_data, pet_mm=pet_data, scale=12, distribution=indices.Distribution.gamma,periodicity=compute.Periodicity.monthly, data_start_year=styr,calibration_year_initial=styr,calibration_year_final=edyr)spei[np.isnan(spei)] = -99 spei_df = pd.DataFrame(data=spei,columns=['SPEI_1']) spei_df.to_csv(outpath+'SPEI12.csv',index=False)print('Finished.')
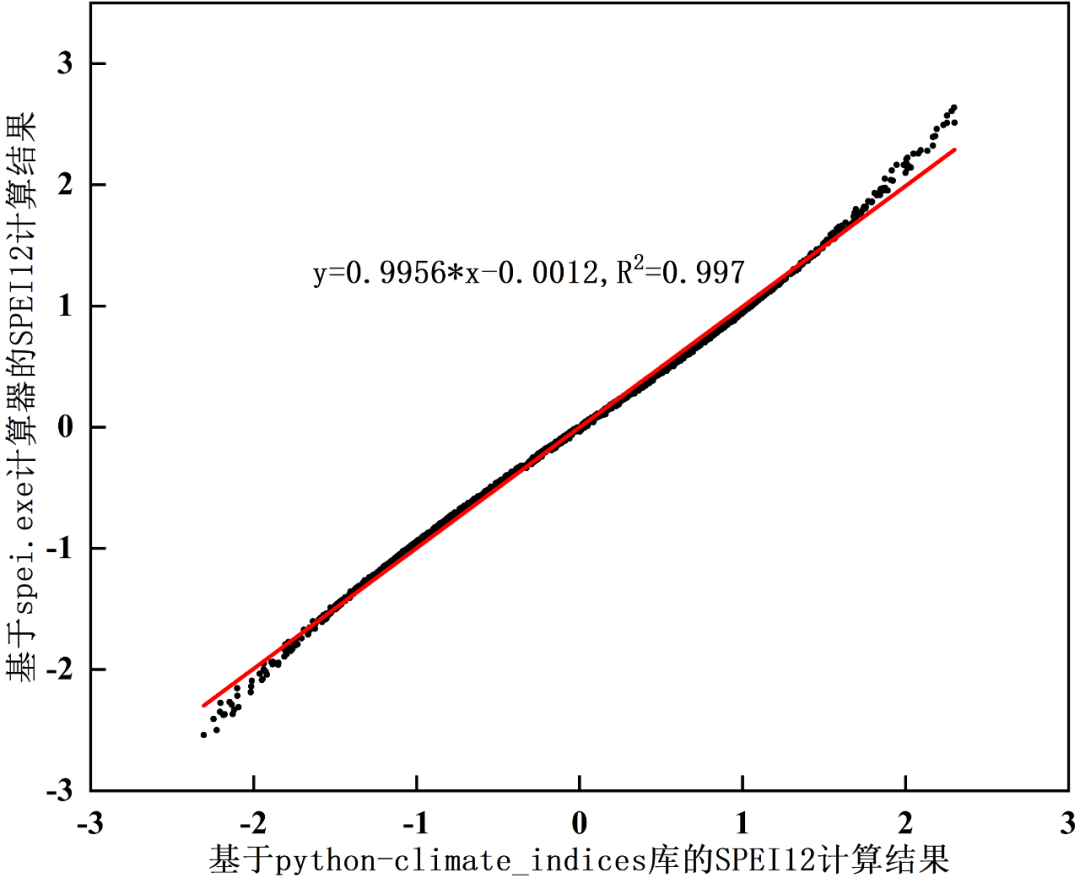
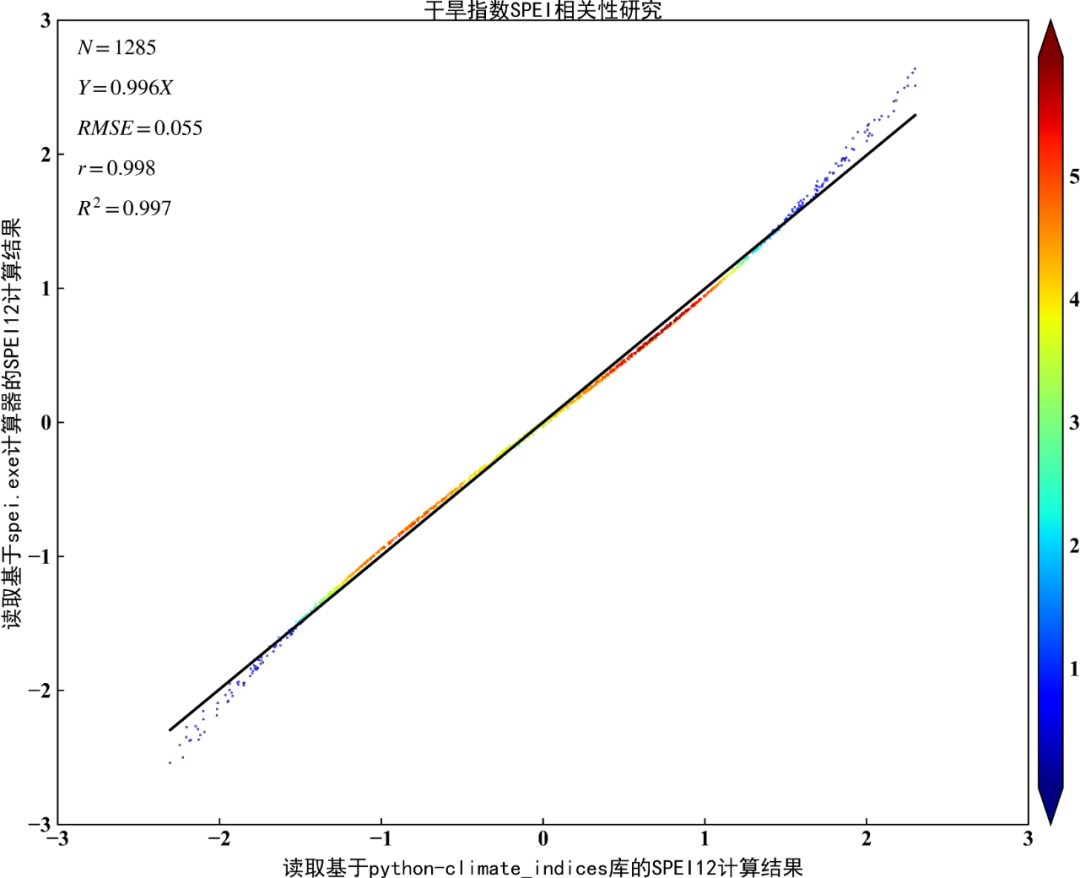
将本文python-climate_indices库的SPEI12计算结果与FAO官网提供的spei.exe计算器的SPEI12计算结果对比:
Origin作图散点图:
Python作图散点密度图:
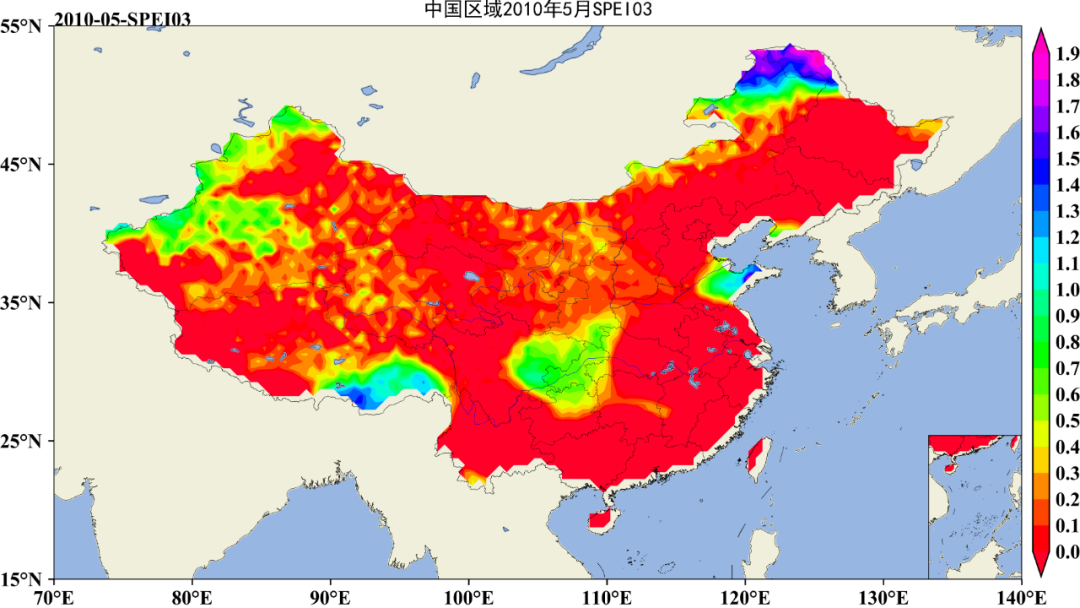
下期更新预告1:
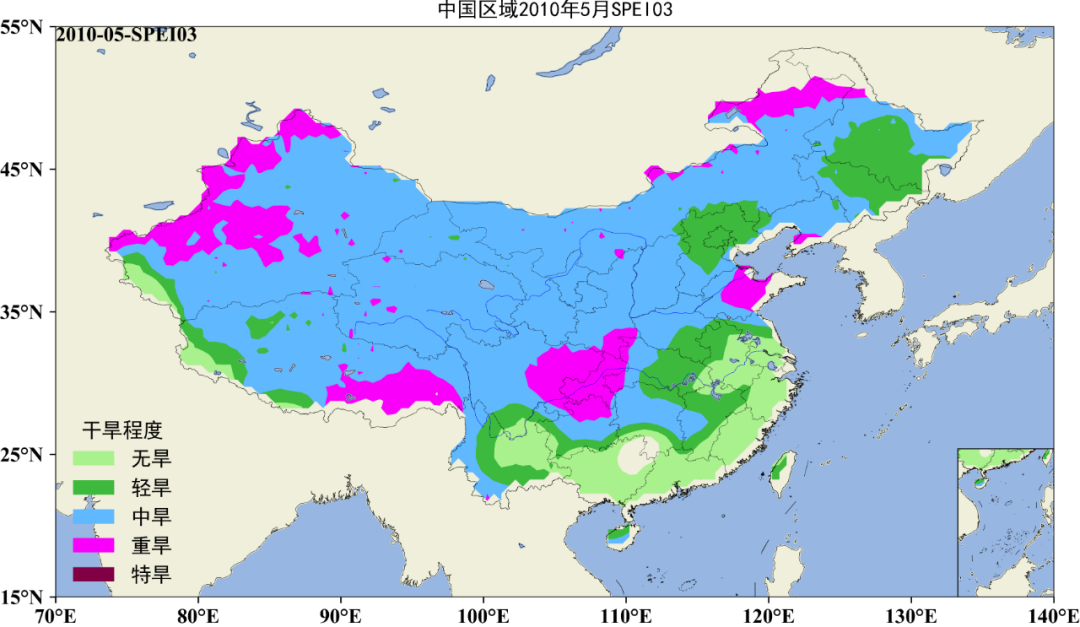
下期更新预告2:
下期更新预告3:
获取本文climate_indices库安装包和示例数据的途径:
气象水文科研猫公众号后台回复:
“climate_indices库安装包和示例数据”,
获取百度云免费下载链接。