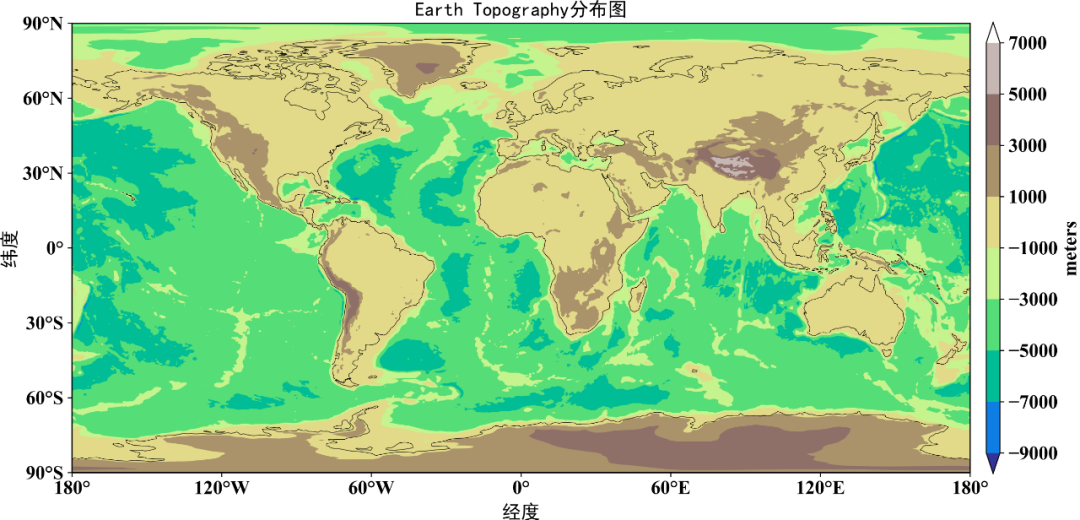
The topography and bathymetry of the Earth according to the ETOPO1 model. The original model has 1 arc-minute grid spacing but here we downsampled to 0.5 degree grid spacing to save space and download times. Heights are referenced to sea level.
0 安装在线DEM地形图库harmonica:
conda install -c conda-forge harmonica
1 Python在线DEM地形图库harmonica
import matplotlib.pyplot as pltimport cartopy.crs as ccrsimport harmonica as hmdata = hm.datasets.fetch_topography_earth()print(data)region=[-180,180,-90,90]proj=ccrs.PlateCarree()fig=plt.figure(figsize=(16,9),dpi=600)ax = plt.axes(projection=proj)ax.set_extent(region,crs=proj)ax.coastlines(lw=0.4)ax.set_global()ax.stock_img()levs = np.arange(-9000,9000,2000)pc=data.topography.plot.contourf(ax=ax,levels=levs,transform=ccrs.PlateCarree(),add_colorbar=False,cmap="terrain",extend='both')cbar=plt.colorbar(pc,shrink=0.75,orientation='vertical',extend='both',pad=0.015,aspect=30) cbar.set_label('meters')ax.set_xticks(np.arange(region[0], region[1] + 1, 60), crs = proj)ax.set_yticks(np.arange(region[-2], region[-1] + 1, 30), crs = proj)ax.xaxis.set_major_formatter(LongitudeFormatter(zero_direction_label=False))ax.yaxis.set_major_formatter(LatitudeFormatter())font3={'family':'SimHei','size':16,'color':'k'}plt.title("Earth Topography分布图",fontdict=font3)plt.ylabel("纬度",fontdict=font3)plt.xlabel("经度",fontdict=font3)plt.savefig('F:/Rpython/lp36/plot103.1.4.png',dpi=800,bbox_inches='tight',pad_inches=0)plt.show()
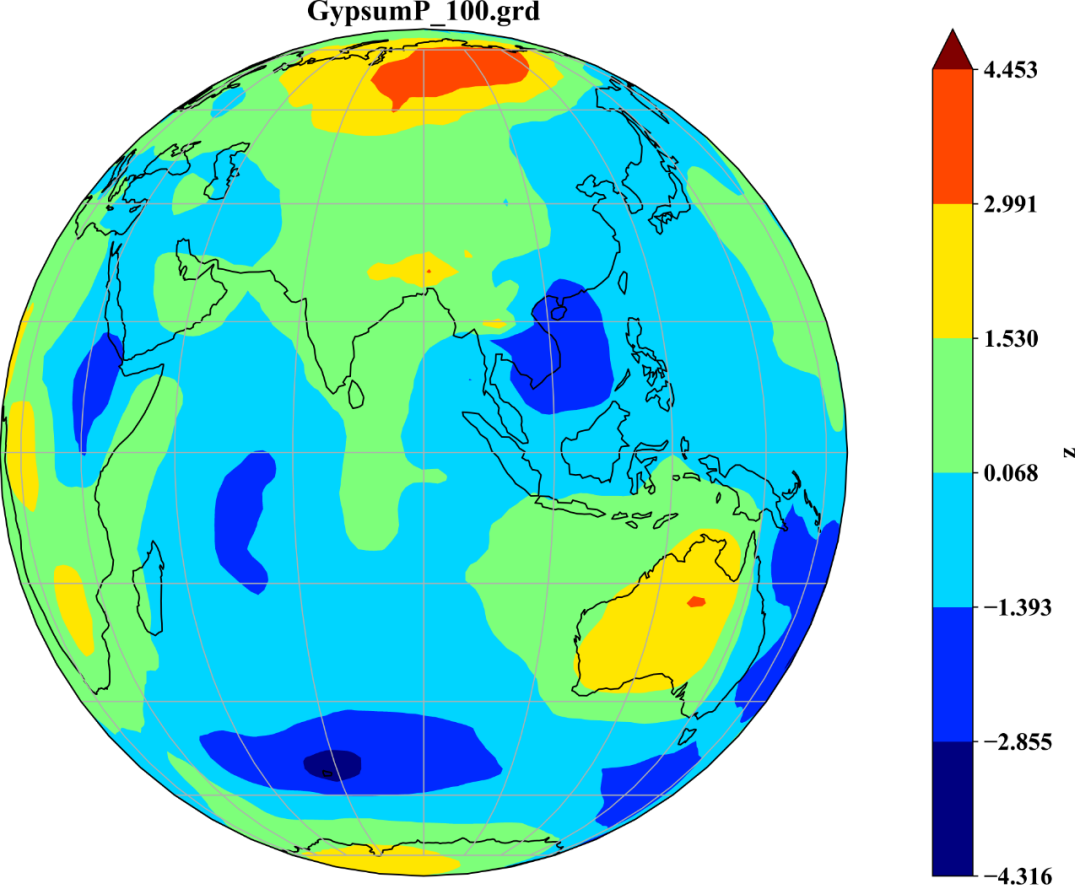
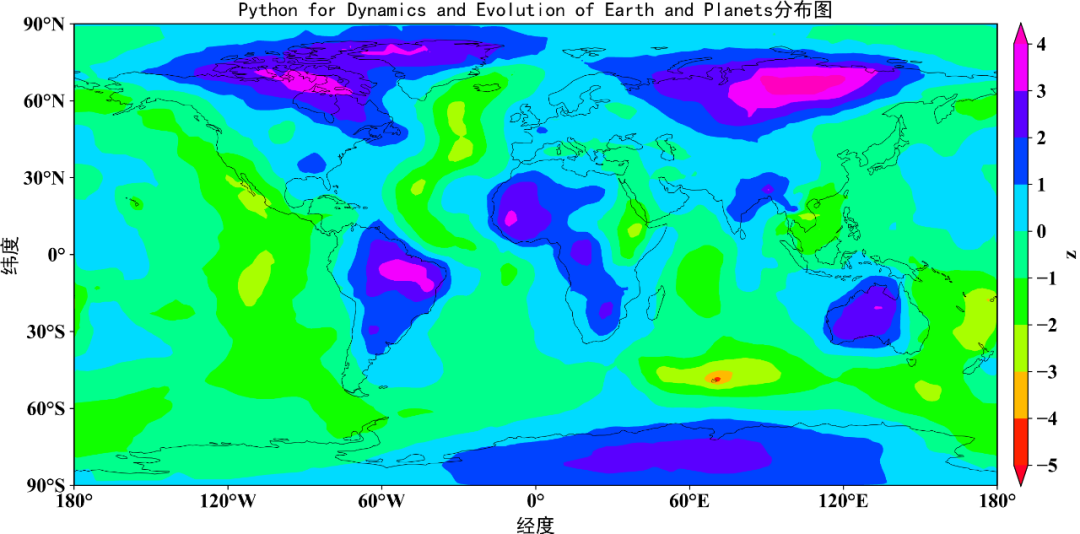
2 Python for Dynamics and Evolution of Earth and Planets
import matplotlib.pyplot as pltimport cartopy.crs as ccrsfrom cartopy.mpl.ticker import LongitudeFormatter, LatitudeFormatterfrom pylab import *import numpy as npimport xarray as xrimport metpy.calc as mpcalcimport metpy.constants as constantsimport cmapsfrom matplotlib import rcParamsconfig = {"font.family":'Times New Roman',"font.size":16,"mathtext.fontset":'stix'}rcParams.update(config)import xarray as xrimport matplotlib as mplmpl.rcParams['figure.figsize'] = [20., 10.]filename =
"F:/Rpython/lp36/data/grd_files_to_interp/GypsumP_100.grd"df = xr.open_dataset(filename, decode_cf=False)print(df)lat=df.latlon=df.lonz=df.zdf.z.plot.contourf()plt.savefig('F:/Rpython/lp36/plot103.1.1.png',dpi=800,bbox_inches='tight',pad_inches=0)plt.show()
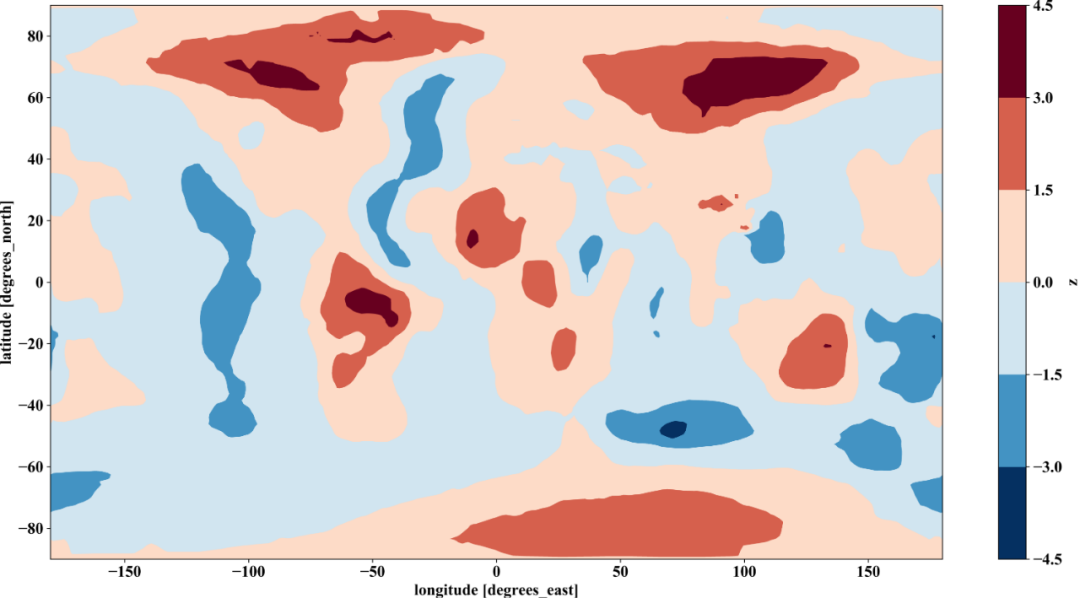
region=[-180,180,-90,90]proj=ccrs.PlateCarree()fig=plt.figure(figsize=(16,9),dpi=600)ax = plt.axes(projection=proj)ax.set_extent(region,crs=proj)ax.coastlines(lw=0.4)ax.set_global()ax.stock_img()levs = np.arange(-5,5,1)mfc_contourf=ax.contourf(lon,lat,z,levels=levs,cmap='gist_rainbow',extend='both')cbar=plt.colorbar(mfc_contourf,shrink=0.75,orientation='vertical',extend='both',pad=0.015,aspect=30) cbar.set_label('z')ax.set_xticks(np.arange(region[0], region[1] + 1, 60), crs = proj)ax.set_yticks(np.arange(region[-2], region[-1] + 1, 30), crs = proj)ax.xaxis.set_major_formatter(LongitudeFormatter(zero_direction_label=False))ax.yaxis.set_major_formatter(LatitudeFormatter())font3={'family':'SimHei','size':16,'color':'k'}plt.title("Python for Dynamics and Evolution of Earth and Planets分布图",fontdict=font3)plt.ylabel("纬度",fontdict=font3)plt.xlabel("经度",fontdict=font3)plt.savefig('F:/Rpython/lp36/plot103.1.2.png',dpi=800,bbox_inches='tight',pad_inches=0)plt.show()
import osimport xarray as xrimport numpy as npimport cartopy.crs as ccrsfrom cartopy.util import add_cyclic_pointimport matplotlib.pyplot as pltfilename = "F:/Rpython/lp36/data/grd_files_to_interp/GypsumP_100.grd"dset = xr.open_dataset(filename, decode_cf=False)z = dset['z'][:,:]dset.close()zmin = dset['z'].min()zmax = dset['z'].max()fig = plt.figure(figsize=[20, 10])ax = fig.add_subplot(1, 1, 1, projection=ccrs.Orthographic(central_longitude=90))z.plot.contourf(ax=ax,transform=ccrs.PlateCarree(),extend='max',vmin=zmin,vmax=zmax,cmap='jet')ax.set_title(df.title)ax.coastlines()ax.gridlines()plt.savefig('F:/Rpython/lp36/plot103.1.3.png',dpi=800,bbox_inches='tight',pad_inches=0)plt.show()