
Matplotlib
Matplotlib 是一个 Python 的 2D绘图库,它以各种硬拷贝格式和跨平台的交互式环境生成出版质量级别的图形。
Python宇宙的绘图库层出不穷,比如boken seaborn pyechart altair plotly pygal ggplot等等。这些库各有优势,很多也是基于Matplotlib的,用起来确实极端代码实现很酷的图表,但是也会失去一些主动性和乐趣。
今天向大家推荐一个开源项目,包括PDF书,完整代码,各种已实现图表。
https://github.com/rougier/scientific-visualization-book/
比如这个sin-cos动图的实现

import numpy as np
import matplotlib.pyplot as plt
import matplotlib.animation as animation

fig = plt.figure(figsize=(7, 2))
ax = plt.subplot()

X = np.linspace(-np.pi, np.pi, 256, endpoint=True)
C, S = np.cos(X), np.sin(X)
(line1,) = ax.plot(X, C, marker="o", markevery=[-1], markeredgecolor="white")
(line2,) = ax.plot(X, S, marker="o", markevery=[-1], markeredgecolor="white")
text = ax.text(0.01, 0.95, "Test", ha="left", va="top", transform=ax.transAxes)
ax.set_xticks([])
ax.set_yticks([])


def update(frame):
    line1.set_data(X[:frame], C[:frame])
    line2.set_data(X[:frame], S[:frame])
    text.set_text("Frame %d" % frame)
    if frame in [1, 32, 128, 255]:
        plt.savefig("../../figures/animation/sine-cosine-frame-%03d.pdf" % frame)
    return line1, line2, text


plt.tight_layout()
writer = animation.FFMpegWriter(fps=30)
anim = animation.FuncAnimation(fig, update, interval=10, frames=len(X))
from tqdm.autonotebook import tqdm

bar = tqdm(total=len(X))
anim.save(
    "../../figures/animation/sine-cosine.mp4",
    writer=writer,
    dpi=100,
    progress_callback=lambda i, n: bar.update(1),
)
bar.close()
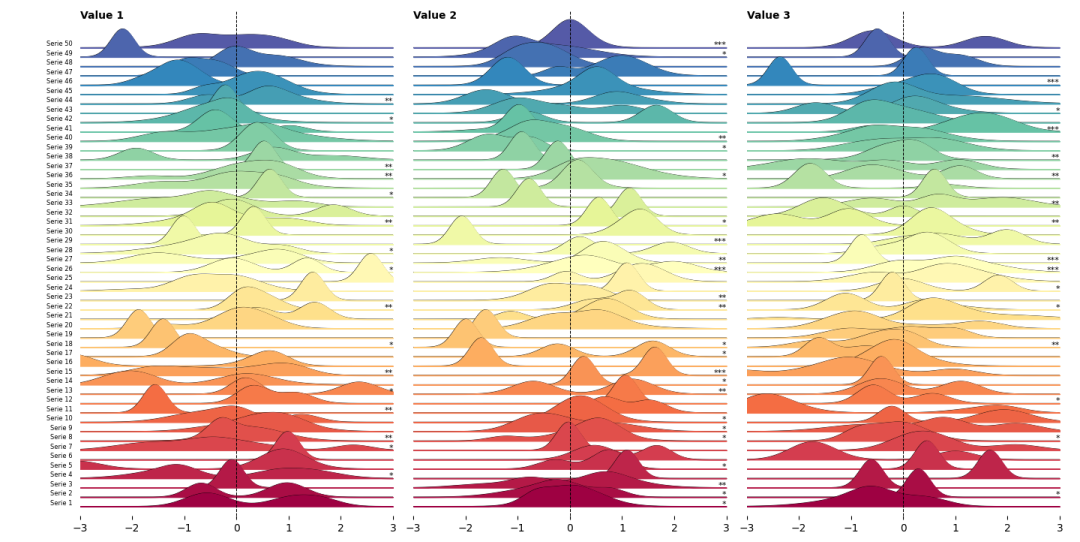
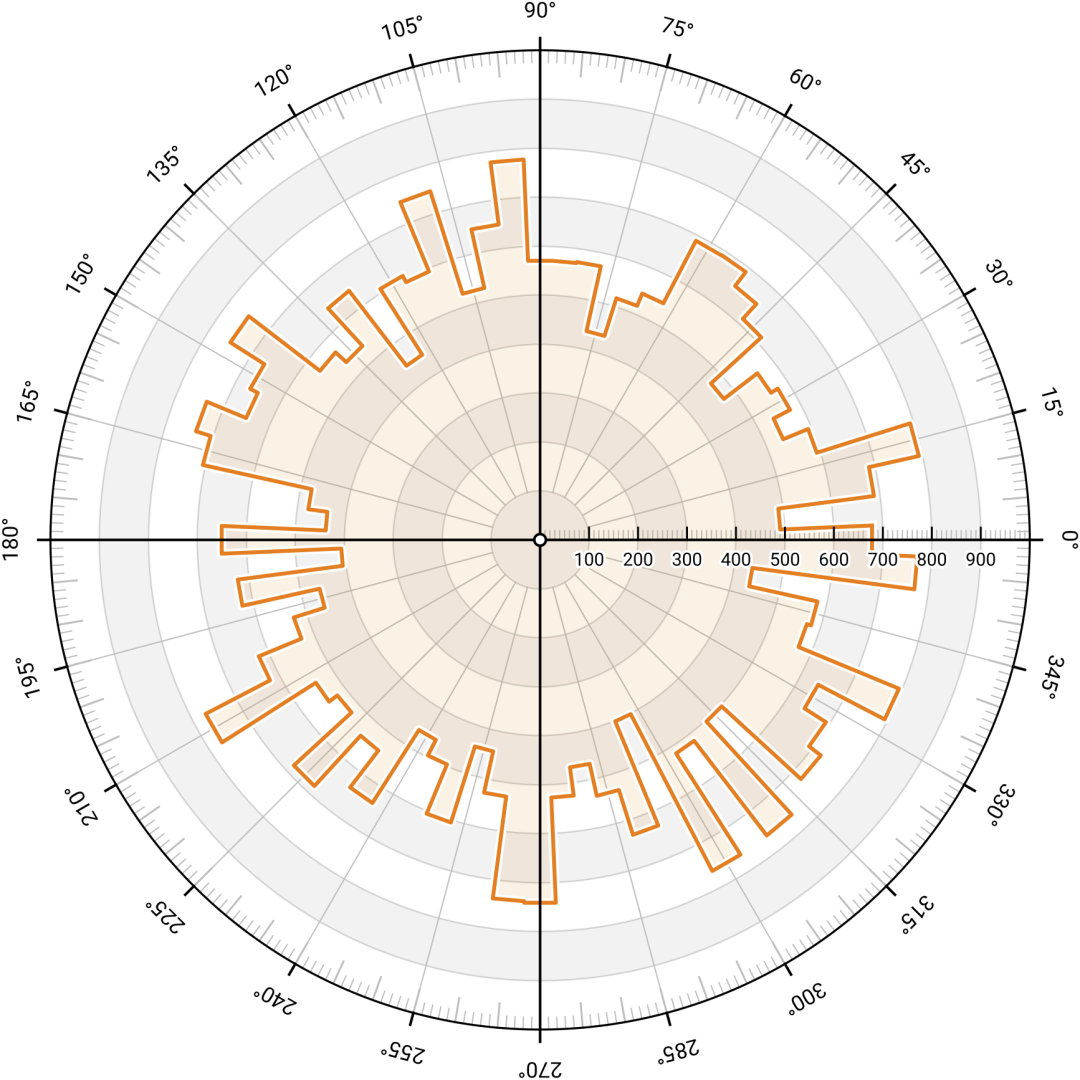
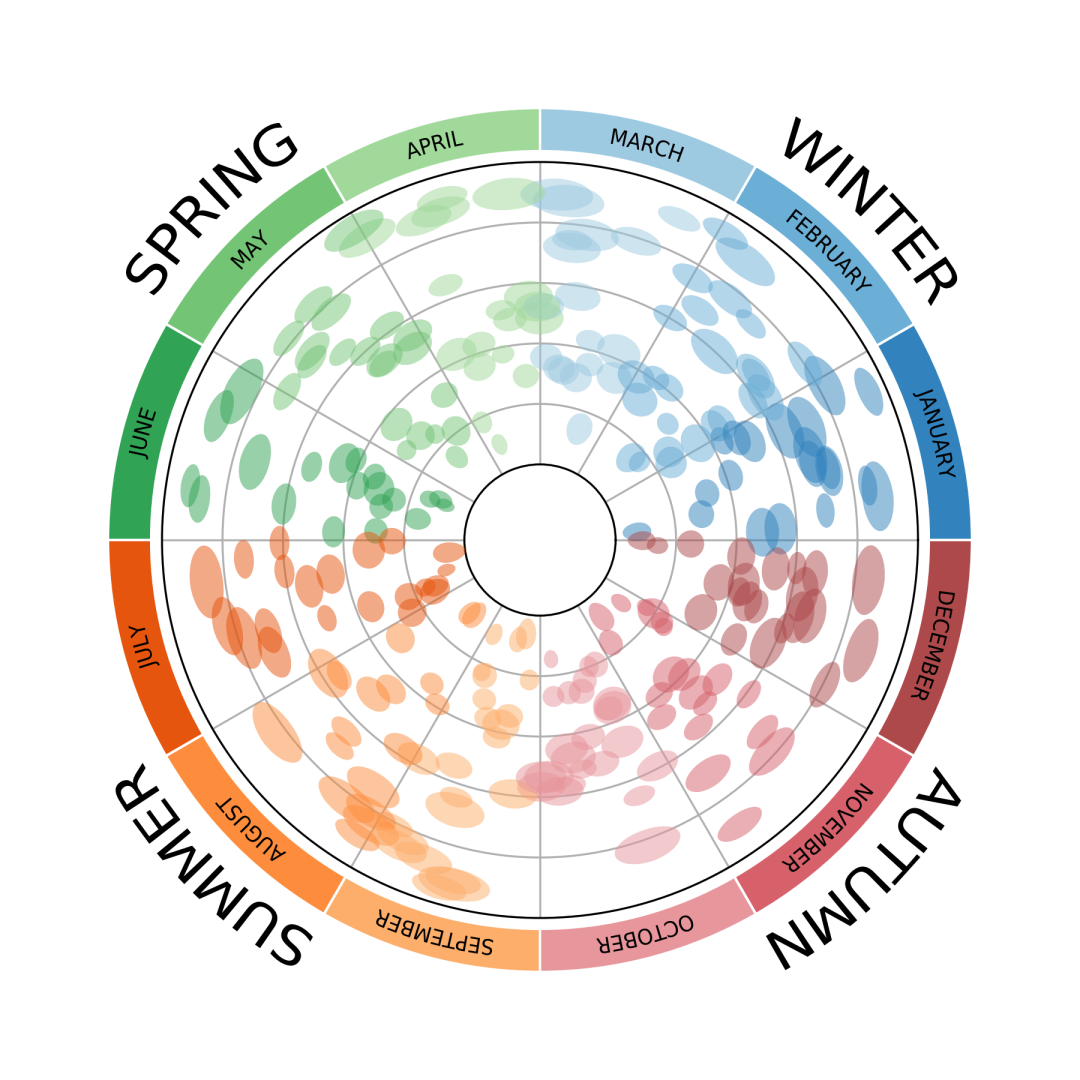
更多漂亮的案例


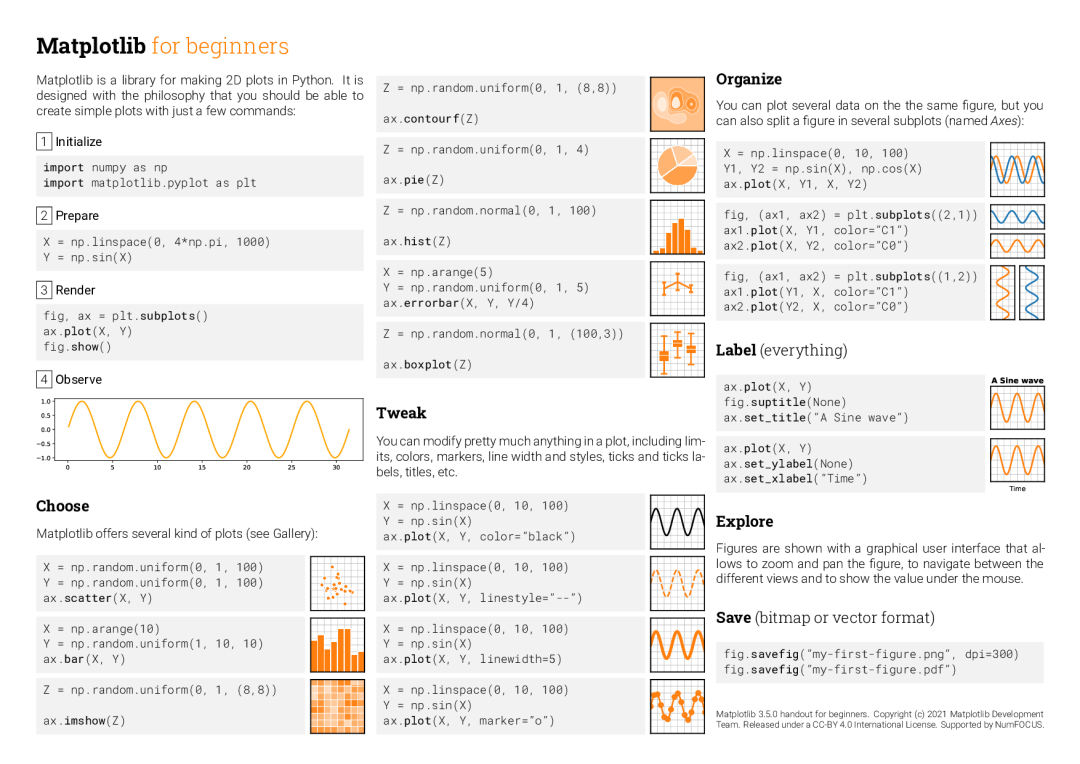
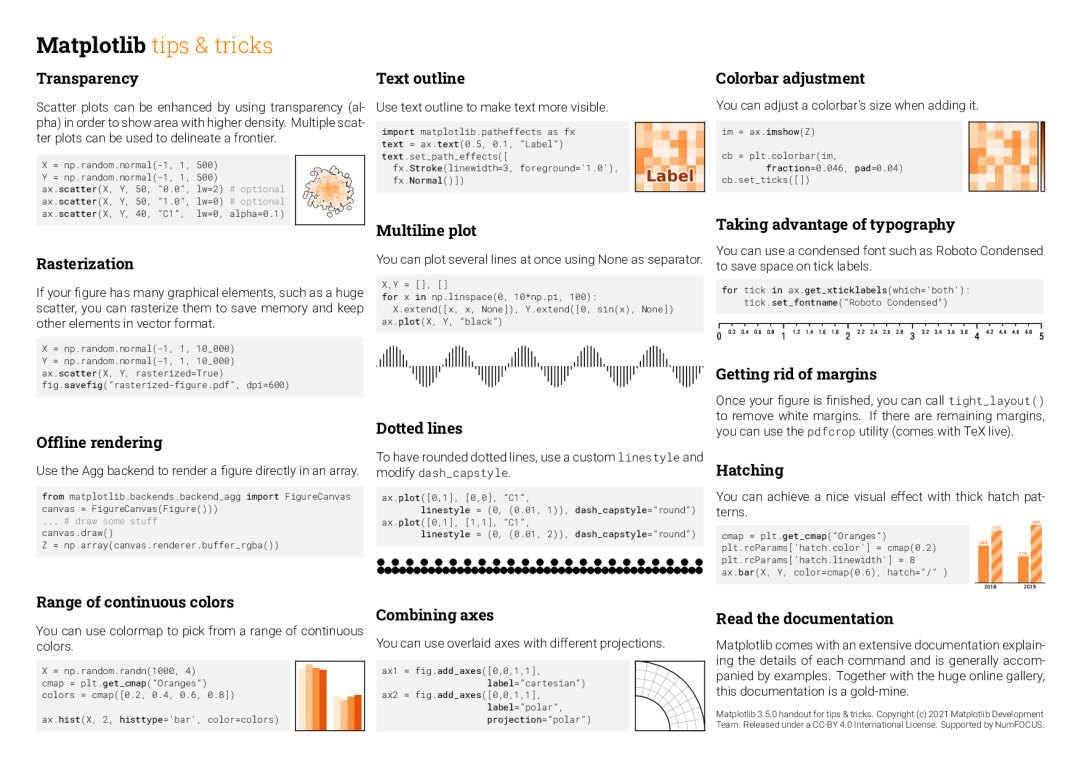
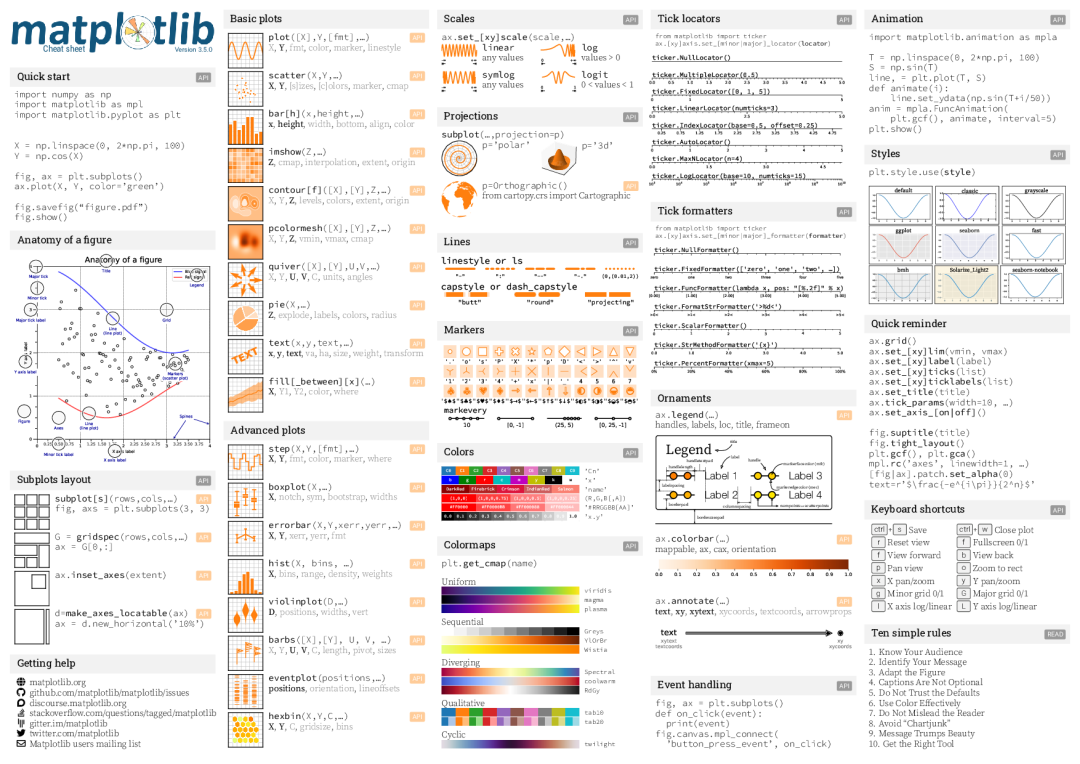
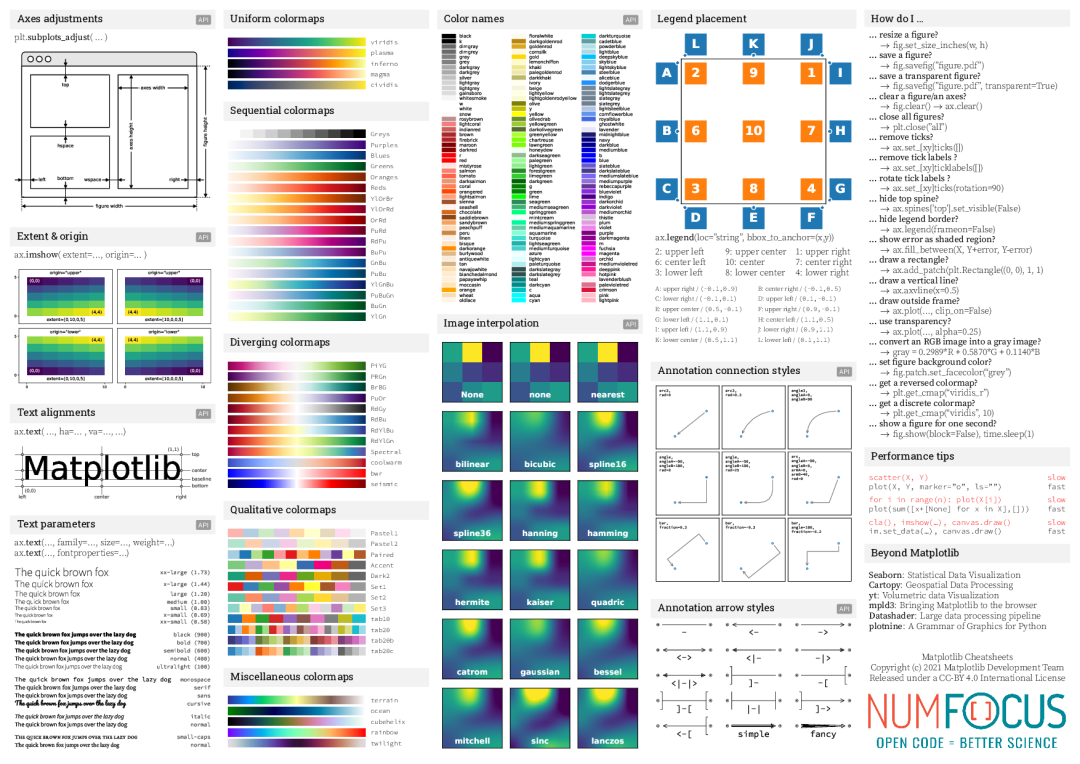
最后送大家5张matplotlib必备速查表
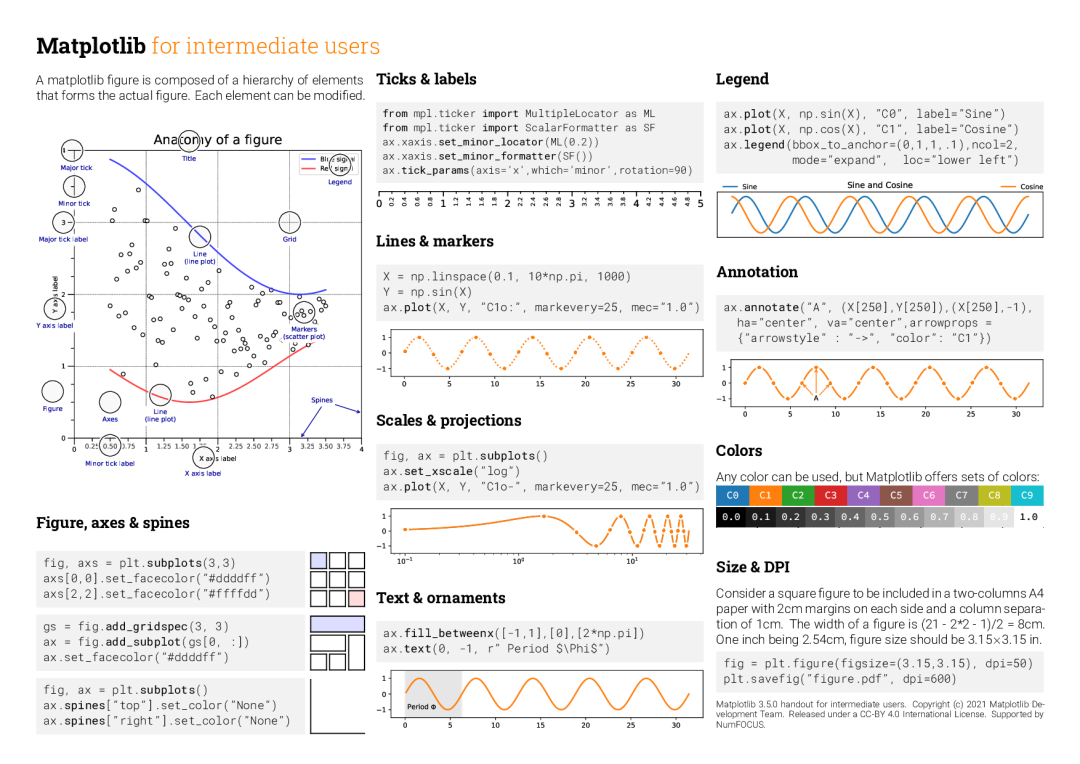
pdf书/代码/高清速查表已打包,公众号后台回复【速查表】获取


