1 热带气旋 (TC) 最佳轨迹数据集由世界各地的多个区域专业气象中心 (RSMC)、机构或项目进行分析、维护和托管。这些机构包括:
1.1 JTWC:联合台风预警中心,海军海洋学门户。
该机构目前托管着除北大西洋以外的几个海洋盆地的 TC 数据集,即西太平洋盆地 (BWP)、北印度洋 (BIO) 和南半球盆地 (BSH)。
https://www.metoc.navy.mil/jtwc/jtwc.html?best-tracks
1.2 CMA:中国气象局。
该机构仅托管了北太平洋西部的 TC 数据集。
http://tcdata.typhoon.org.cn/en/zjljsjj_zlhq.html
1.3 JMA:日本气象厅 RSMC 东京台风中心。
该机构仅托管了北太平洋西部的 TC 数据集
https://www.jma.go.jp/jma/jma-eng/jma-center/rsmc-hp-pub-eg/trackarchives.html
1.4 NHC:国家飓风中心,国家海洋和大气管理局。
该机构托管了北大西洋和北太平洋东部的 TC 数据集,JTWC 未涵盖这些数据集。
https://www.nhc.noaa.gov/data/#hurdat
1.5 IBTrACS:国际气候管理最佳轨道档案。
该项目将其他机构(不止上述机构)已有的最佳跟踪数据集合并到全球 TC 数据库中。
https://www.ncdc.noaa.gov/ibtracs/
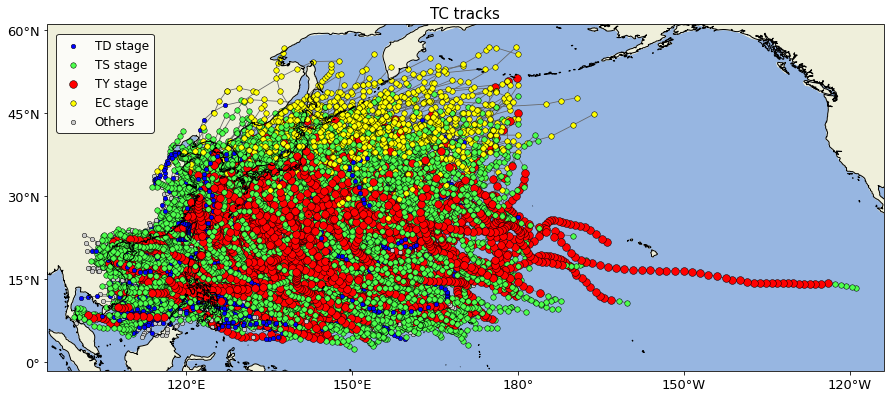
2 besttracks库绘制1949-2020年中国CMA热带气旋最佳路径:
windows安装besttracks库:
pip install D:\anaconda\pkgs\besttracks-master.zip
from besttracks import parse_TCsimport matplotlib.pyplot as plt# parse dataset from CMATCs_CMA=parse_TCs('F:/Rpython/lp37/data37/CMABSTdata/CH*.txt', agency='CMA')# Brief describe the datasetprint(TCs_CMA)# Plotting all TC tracksTCs_CMA.plot_tracks()plt.savefig('F:/Rpython/lp37/plot1.1.png',dpi=800,bbox_inches='tight',pad_inches=0)plt.show()
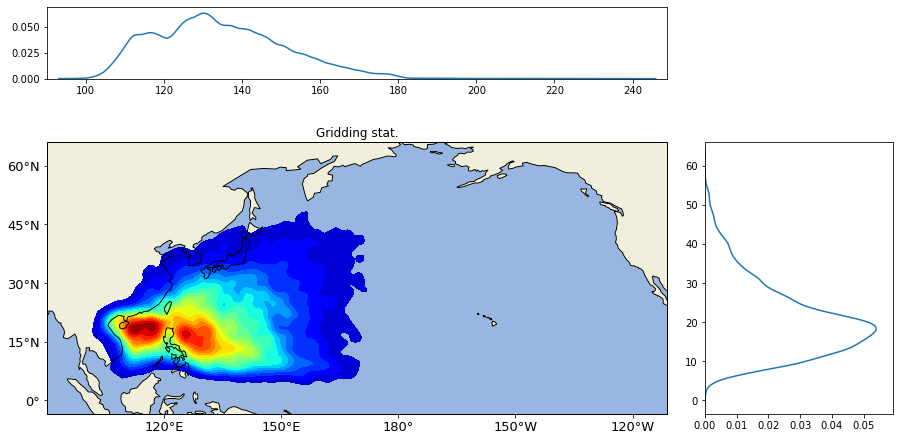
# binning the tracks into gridded dataTCs_CMA.binning()plt.savefig('F:/Rpython/lp37/plot1.2.png',dpi=800,bbox_inches='tight',pad_inches=0)plt.show()
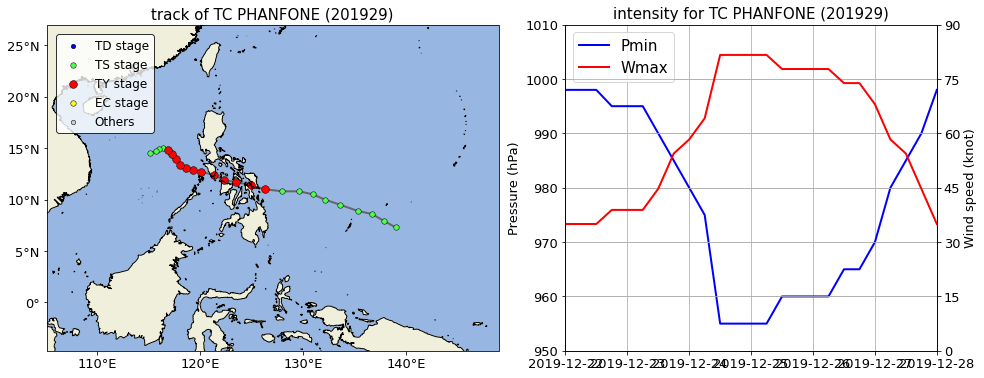
# Selecting a single TCtc = TCs_CMA[-1]# Briefly descibe the TCprint(tc)# Plot the TC track and intensitytc.plot()plt.savefig('F:/Rpython/lp37/plot1.3.png',dpi=800,bbox_inches='tight',pad_inches=0)plt.show()
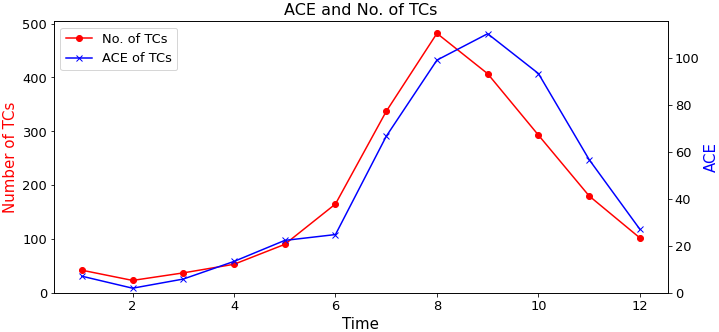
# plot the climatological timeseries of No. and ACETCs_CMA.plot_timeseries(freq='annual')plt.savefig('F:/Rpython/lp37/plot1.4.png',dpi=800,bbox_inches='tight',pad_inches=0)plt.show()
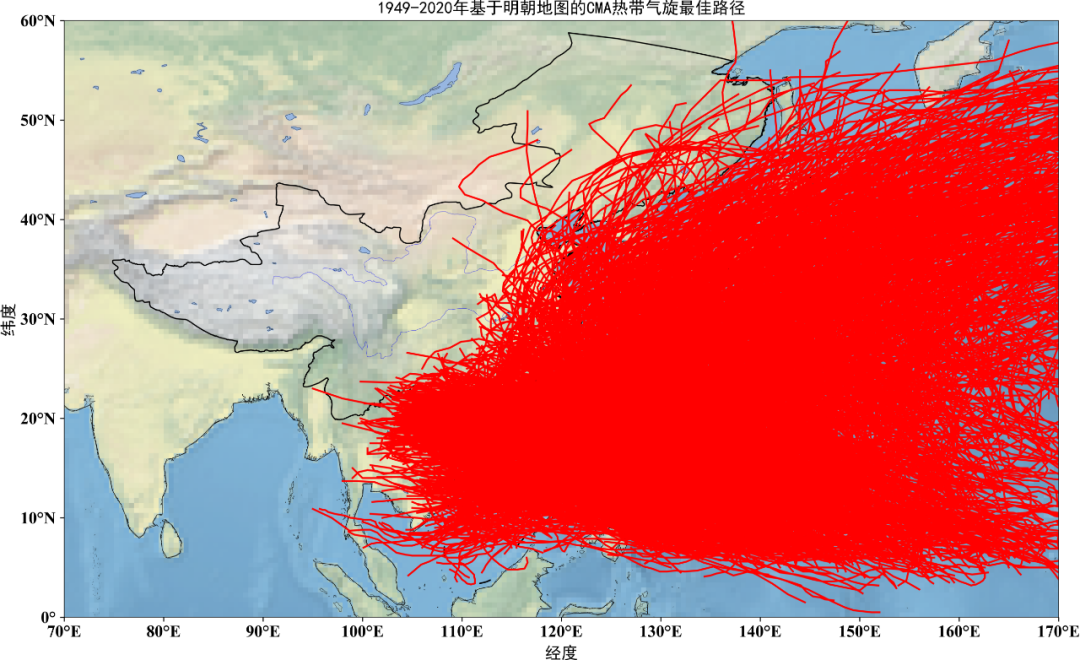
3 绘制1949-2020年基于明朝地图的CMA热带气旋最佳路径:
import osimport numpy as npimport matplotlib.pyplot as pltimport shapefileimport cartopy.feature as cfeaturefrom cartopy.io.shapereader import Readerfrom cartopy.mpl.ticker import LongitudeFormatter,LatitudeFormatterimport numpy as npimport cartopy.crs as ccrsfrom matplotlib import
rcParamsconfig = {"font.family":'Times New Roman',"font.size":14,"mathtext.fontset":'stix'}rcParams.update(config)region=[70, 170, 0, 60]proj=ccrs.PlateCarree()fig=plt.figure(figsize=(16,9),dpi=600)ax = plt.axes(projection = proj)ax.set_extent(region, crs = proj)ax.coastlines(lw=0.4)Ming_shp=shapefile.Reader("F:/Rpython/lp35/data/shp2/ming.shp")path=r"F:/Rpython/lp37/data37/CMABSTdata2"files= os.listdir(path) data=[]all=[]for file in files: if not os.path.isdir(file): f = open(path+"/"+file) tmp=f.readlines() for i in tmp: line=i.split() if(line[0]=='66666'): if(len(all)>0): data.append(all) all=[] else: we=(int(line[2])*0.1,int(line[3])*0.1) all.append(we)print(len(data))ans=1x=[]y=[]for typhoon in data: length=len(typhoon) print("%d is process!" % ans) ans += 1 for i in range(length): x.append(typhoon[i][1]) y.append(typhoon[i][0]) ax.plot(x, y, color='r',linewidth=1.5) x = [] y = []ax.set_xticks(np.arange(region[0], region[1] + 1, 10), crs = proj)ax.set_yticks(np.arange(region[-2], region[-1] + 1, 10), crs = proj)ax.xaxis.set_major_formatter(LongitudeFormatter(zero_direction_label=False))ax.yaxis.set_major_formatter(LatitudeFormatter())ax.stock_img()ax.add_feature(cfeature.OCEAN.with_scale('50m'))ax.add_feature(cfeature.LAND.with_scale('50m'))ax.add_feature(cfeature.LAKES.with_scale('50m'))ax.add_geometries(Reader(r'F:/Rpython/lp27/data/river1.shp').geometries(),ccrs.PlateCarree(),facecolor='none',edgecolor='b',linewidth=0.2)ax.add_geometries(Reader(r'F:/Rpython/lp35/data/shp2/ming.shp').geometries(),ccrs.PlateCarree(),facecolor='none',edgecolor='k',linewidth=1)ax.add_geometries(Reader(r'F:/Rpython/lp35/data/shp2/nineline.shp').geometries(),ccrs.PlateCarree(),facecolor='none',edgecolor='k',linewidth=1)ax.add_geometries(Reader(r'F:/Rpython/lp27/data/ne_10m_land.shp').geometries(),ccrs.PlateCarree(),facecolor='none',edgecolor='k',linewidth=0.2)ax.add_geometries(Reader(r'F:/Rpython/lp27/data/ne_50m_lakes.shp').geometries(),ccrs.PlateCarree(),facecolor='none',edgecolor='k',linewidth=0.2)ax0 = plt.gca()ax0.outline_patch.set_linewidth(0.5)font3={'family':'SimHei','size':14,'color':'k'}
plt.title("1949-2020年基于明朝地图的CMA热带气旋最佳路径",fontdict=font3)plt.ylabel("纬度",fontdict=font3)plt.xlabel("经度",fontdict=font3)plt.savefig('F:/Rpython/lp37/plot2.png',dpi=800,bbox_inches='tight',pad_inches=0)plt.show()
获取本文Python绘制台风轨迹图源代码和数据的途径,


