
作者:FenG_Vnc
来源:见文末
环境 :
一台 centos 6.7
IP地址:
192.168.88.250
软件版本 :
ElasticSearch 2.1.0 Logstash 2.1.1 Kibana 4.3.1 JDK 1.8.0.77
JDK 我这里没有地址 就不连接了
下载好JDK 放在路径/usr/local/java
编辑配置文件 /etc/profile
export JAVA_HOME=/usr/local/java/jdk1.8.0_77
export PATH=$JAVA_HOME/bin:$PATH
加入这两句以后 然后 source /etc/profile
确认生效 java -version
[root@master ~]# java -version
java version "1.8.0_77"
Java(TM) SE Runtime Environment (build 1.8.0_77-b03)
Java HotSpot(TM) 64-Bit Server VM (build 25.77-b03, mixed mode)
1、 搭建 ElasticSearch
wget https://download.elasticsearch.org/elasticsearch/release/org/elasticsearch/distribution/tar/elasticsearch/2.1.0/elasticsearch-2.1.0.tar.gz
tar xf elasticsearch-2.1.0.tar.gz
cd /usr/local/elasticsearch-2.1.0/bin
./plugin -install mobz/elasticsearch-head # web集群管理插件 安装好了以后可以在plugin文件发现多了一个head
./elasticsearch -Des.insecure.allow.root=true #加这个参数才可以root启动
curl -X GET 192.168.88.250:9200 #curl 测试
{
"name" : "Reeva Payge",
"cluster_name" : "elasticsearch",
"version" : {
"number" : "2.1.0",
"build_hash" : "72cd1f1a3eee09505e036106146dc1949dc5dc87",
"build_timestamp" : "2015-11-18T22:40:03Z",
"build_snapshot" : false,
"lucene_version" : "5.3.1"
},
"tagline" : "You Know, for Search"
}
web地址 http
://192.168.88.250:9200/_plugin/head/
2、搭建NGINX
wget 搭建nginx之前需要安装 pcre
tar xf nginx-1.7.8.tar.gz
cd /usr/local/nginx
vim /usr/local/nginx/conf/nginx.conf
worker_processes 1;
events {
worker_connections 1024;
}
http {
upstream kibana4 {
server 127.0.0.1:5601 fail_timeout=0;
}
include mime.types;
default_type application/octet-stream;
log_format json '{"@timestamp":"$time_iso8601",'
'"host":"$server_addr",'
'"clientip":"$remote_addr",'
'"size":$body_bytes_sent,'
'"responsetime":$request_time,'
'"upstreamtime":"$upstream_response_time",'
'"upstreamhost":"$upstream_addr",'
'"http_host":"$host",'
'"url":"$uri",'
'"xff":"$http_x_forwarded_for",'
'"referer":"$http_referer",'
'"agent":"$http_user_agent",'
'"status":"$status"}';
access_log /var/log/nginx/access.log_json json;
error_log /var/log/nginx/error.log;
sendfile on;
keepalive_timeout 65;
server {
listen 80;
server_name localhost;
location / {
root html;
index index.html index.htm;
}
error_page 500 502 503 504 /50x.html;
location = /50x.html {
root html;
}
}
server {
listen *:80;
server_name kibana_server;
access_log /var/log/nginx/kibana.srv-log-dev.log;
error_log /var/log/nginx/kibana.srv-log-dev.error.log;
location / {
root /var/www/kibana;
index index.html index.htm;
}
location ~ ^/kibana4/.* {
proxy_pass http://kibana4;
rewrite ^/kibana4/(.*) /$1 break;
proxy_set_header X-Forwarded-For $proxy_add_x_forwarded_for;
proxy_set_header Host $host;
auth_basic "Restricted";
auth_basic_user_file /etc/nginx/conf.d/kibana.myhost.org.htpasswd;
}
}
}
3、搭建 Logstash
wget https:
tar xf logstash-2.1.1.tar.gz
cd /usr/local/logstash-2.1.1/bin
vim stdin.conf
input{
file {
path => "/var/log/nginx/access.log_json"
codec => "json" json编码
}
}
filter {
mutate {
split => ["upstreamtime", ","]
}
mutate {
convert => ["upstreamtime", "float"]
}
}
output{
elasticsearch {
hosts => ["192.168.88.250:9200"]
index => "logstash-%{type}-%{+YYYY.MM.dd}"
document_type => "%{type}"
workers => 1
flush_size => 20000
idle_flush_time => 10
template_overwrite => true
}
}
./logstash -f stdin.conf &
启动成功以后 打开刚才搭建的web服务器 es就能看到数据
4、搭建Kibana
wget https://download.elastic.co/kibana/kibana/kibana-4.3.1-linux-x64.tar.gz
tar xf kibana-4.3.1-linux-x64.tar.gz
cd /usr/local/kibana-4.3.1-linux-x64/
vim ./config/kibana.yml
elasticsearch.url:
./kibana & 后台启动
启动成功以后 会监听 5601端口
全部搭建好了以后就可以用Kibana查看
地址 : 192.168.88.250:5601
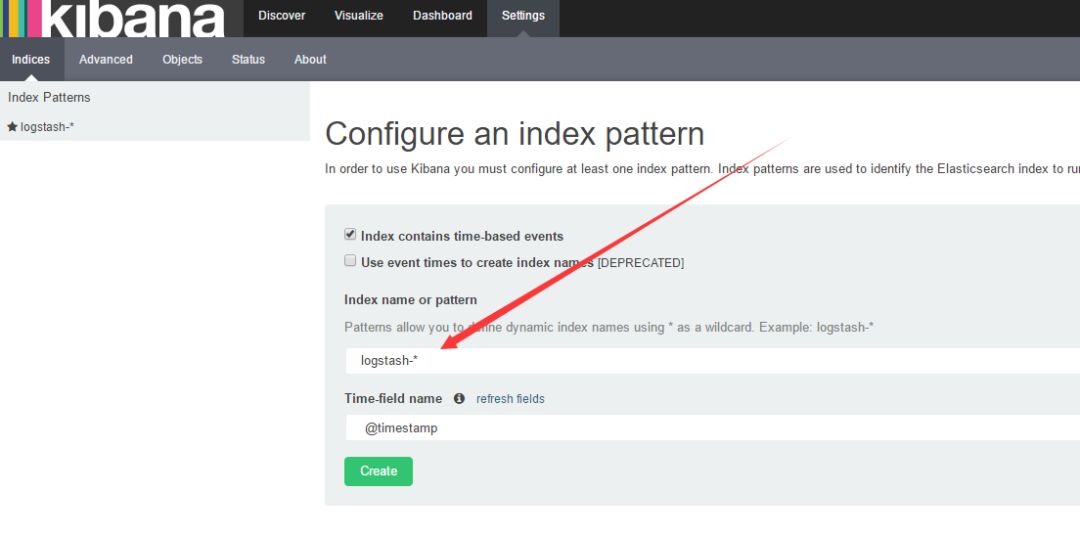
如果create灰色的 说明没有创建索引 打开你的nginx服务器 刷新几下 采集一下数据
然后 选择 左上角的 Discover
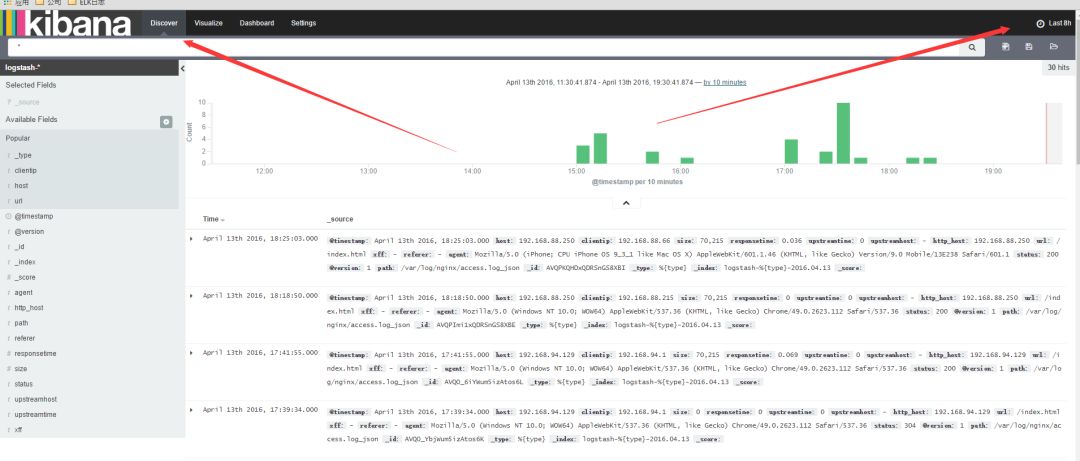
数据可能会出不来 那是因为 Kibana 是根据时间来匹配的 并且 因为 Logstash的采集时间使用的UTC 永远早8个小时
所以设置时间 要设置晚8个小时以后
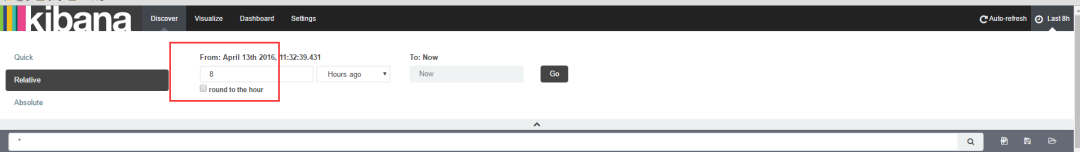
设置好了时间以后 。数据基本就会看的到
这里可以设置你想看到的任意 数据 选择 add 就能看到的 不想看 可以remove
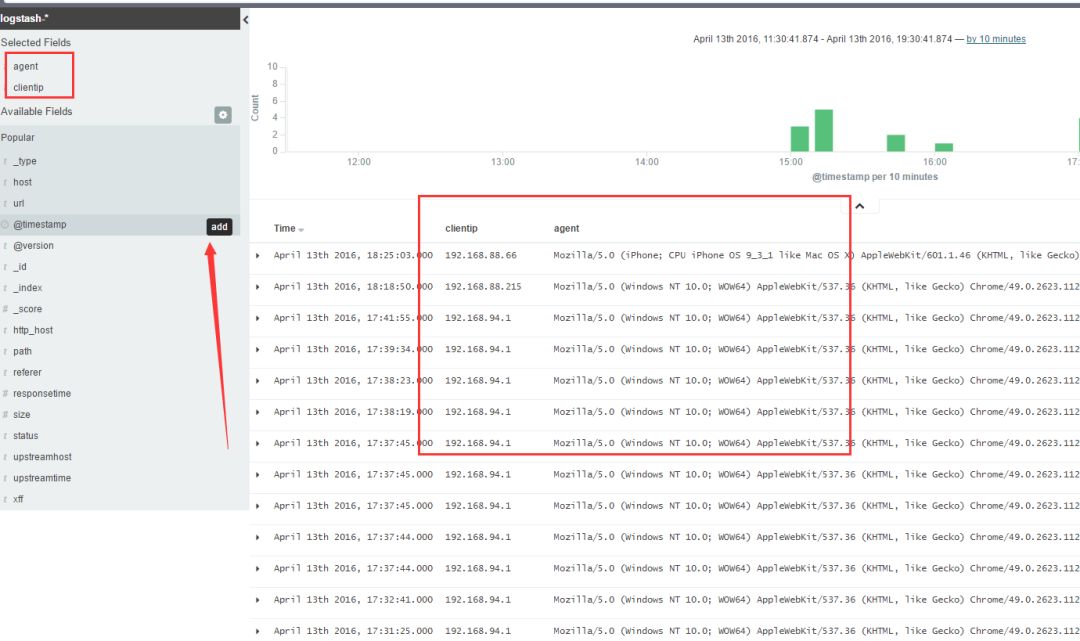
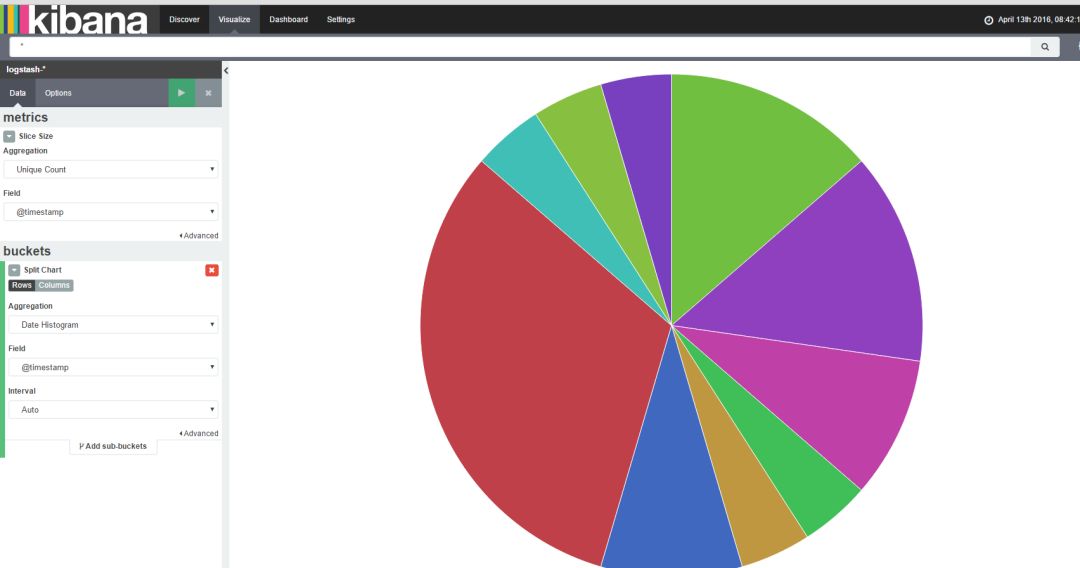
还有后面的 Visualize 也可以个性化定制图标
基本就到此结束了,另外如果 Kibana出不来数据 一般都是因为时间设置不正确。
作者:FenG_Vnc
来源:https://my.oschina.net/u/2333235/blog/658671
《Linux云计算及运维架构师高薪实战班》2018年07月16日即将开课中,120天冲击Linux运维年薪30万,改变速约~~~~
*声明:推送内容及图片来源于网络,部分内容会有所改动,版权归原作者所有,如来源信息有误或侵犯权益,请联系我们删除或授权事宜。
- END -


更多Linux好文请点击【阅读原文】哦
↓↓↓


