
作者:博观厚积
简书专栏:
https://www.jianshu.com/u/2f376f777ef1
1. K-Means聚类原理
K-means算法是很典型的基于距离的聚类算法,采用距离作为相似性的评价指标,即认为两个对象的距离越近,其相似度就越大。其基本思想是:以空间中k个点为中心进行聚类,对最靠近他们的对象归类。通过迭代的方法,逐次更新各聚类中心的值,直至得到最好的聚类结果。各聚类本身尽可能的紧凑,而各聚类之间尽可能的分开。
算法大致流程为:
(1)随机选取k个点作为种子点(这k个点不一定属于数据集);
(2)分别计算每个数据点到k个种子点的距离,离哪个种子点最近,就属于哪类;(3)重新计算k个种子点的坐标(简单常用的方法是求坐标值的平均值作为新的坐标值;
(4)重复2、3步,直到种子点坐标不变或者循环次数完成。
2.数据及其寻找初步的聚类中心
数据为Matlab加载格式(mat),包含X变量,数据来源为(大家可以去这下载):
https://github.com/jdwittenauer/ipython-notebooks/tree/master/data,
X为300*2维变量,由于是2维,所以基本上就是在平面坐标轴上的一些点中进行聚类。
我们首先构建初步寻找聚类中心(centroids,质心)函数,再随机设置初始质心,通过欧氏距离初步判断X的每一个变量属于哪个质心。代码为:
import numpy as np
import pandas as pd
import matplotlib.pyplot as plt
import seaborn as sb from scipy.io import loadmat

def find_closest_centroids(X, centroids):
    m = X.shape[0]
    k = centroids.shape[0] #要聚类的类别个数
    idx = np.zeros(m)

    for i in range(m):
        min_dist = 1000000 #迭代终止条件
        for j in range(k):
            dist = np.sum((X[i,:] - centroids[j,:]) ** 2)
            if dist < min_dist:
                # 记录当前最短距离和其中心的索引值
                min_dist = dist
                idx[i] = j
    return idx
data = loadmat('D:\python\Python ml\ex7data2.mat')
X = data['X']
initial_centroids = np.array([[3, 3], [6, 2], [8, 5]])

idx = find_closest_centroids(X, initial_centroids)
idx[0:3]
在这里先生成m(这里为300)个0向量,即idx,也就是假设X的每个变量均属于0类,然后再根据与初始质心的距离计算dist = np.sum((X[i,:] - centroids[j,:]) ** 2),初步判断每个变量归属哪个类,最终替代idx中的0.
3.不断迭代寻找质心的位置并实现kmeans算法
上述idx得到的300维向量是判断X中每个变量的归属类别,在此基础上,再对初始质心集群位置不断调整,寻找最优质心。
def compute_centroids(X, idx, k):
    m, n = X.shape
    centroids = np.zeros((k, n))

    for i in range(k):
        indices = np.where(idx == i)
        centroids[i,:] = (np.sum(X[indices,:], axis=1) / len(indices[0])).ravel()
    #这里简单的将该类中心的所有数值求平均值作为新的类中心
return centroids
compute_centroids(X, idx, 3)
根据上述函数,来构建kmeans函数实现K-means聚类算法。然后根据得到的每个变量归属类别与质心坐标,进行可视化。
def run_k_means(X, initial_centroids, max_iters):
m, n = X.shape
k = initial_centroids.shape[0]
idx = np.zeros(m)
centroids = initial_centroids
for i in range(max_iters):
idx = find_closest_centroids(X, centroids)
centroids = compute_centroids(X, idx, k)
return idx, centroids
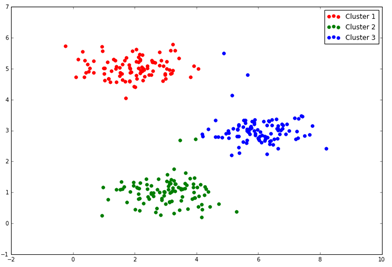
idx, centroids = run_k_means(X, initial_centroids, 10) cluster1 = X[np.where(idx == 0)[0],:] #获取X中属于第一个类别的数据集合,即类别1的点 cluster2 = X[np.where(idx == 1)[0],:] cluster3 = X[np.where(idx == 2)[0],:]
fig, ax = plt.subplots(figsize=(12,8))
ax.scatter(cluster1[:,0], cluster1[:,1], s=30, color='r', label='Cluster 1')
ax.scatter(cluster2[:,0], cluster2[:,1], s=30, color='g', label='Cluster 2')
ax.scatter(cluster3[:,0], cluster3[:,1], s=30, color='b', label='Cluster 3')
ax.legend()
plt.show()
得到图形如下:
4.关于初始化质心的设置
我们前边设置的初始质心:[3, 3], [6, 2], [8, 5],是事先设定的,并由此生成idx(每一变量归属类别的向量),这是后边进行kmeans聚类的基础,实际上对于二维以上数据,由于无法在平面坐标轴展示,很难一开始就设定较好的初始质心,另外,初始质心的设定也可能会影响算法的收敛性。所以需要我们再构造个初始化质心设定函数,来更好地设置初始质心。
def init_centroids(X, k):
m, n = X.shape
centroids = np.zeros((k, n)) #初始化零矩阵
idx = np.random.randint(0, m, k) #返回0-m之间的整数值

for i in range(k):
    centroids[i,:] = X[idx[i],:]

return centroids
init_centroids(X, 3)
这里所生成的初始质心位置,其实就是从X的数据中随机找3个变量作为初始值。在此基础上,令initial_centroids = init_centroids(X, 3),然后代入前边的code中,重新运行一遍即可。
赞赏作者
Python爱好者社区福利大放送!!!
扫码或者点击阅读原文,领取福利

扫码或者点击阅读原文,领取福利


