1. 深度学习可视化
深度学习的过程是一个黑盒子,模型通过大量的权重去学习拟合输入的数据和学习目标,模型的性能很大程度上取决于模型的输入的数据;深度学习的拟合效果往往出乎我们的的想象,但是模型如何拟合数据和学习目标之间的关系,我们知之甚少。
有时候训练数据和验证集的选取,模型真正学习到的东西和我们人类认知背道而驰。网上看到的一则案例:有人采集了100张隐藏在树丛中的坦克照片,以及另100张仅有树丛的照片, 用神经网络训练一个识别坦克的分类器,在训练和验证上模型都达到了100%的精确度,(100%基本上是数据泄露了); 原因出在100张坦克是在晴天拍摄,另外100张是阴天拍摄,模型似乎只关注到了天空的颜色。
本文针对keras对常用的机器视觉的可视化做了总结。
2. 可视化模型说明
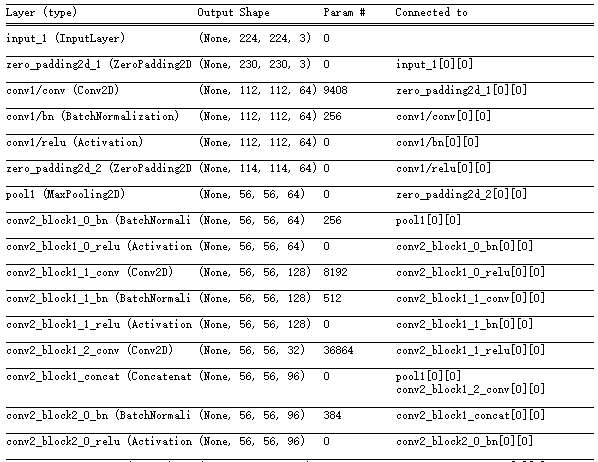
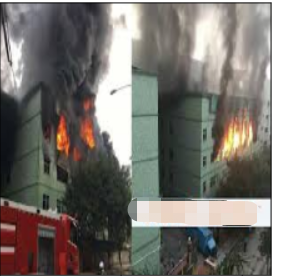
本文要可视化模型为densnet121,其他模型类似,只是卷积层不一样,目标是对于火灾的识别
from keras.applications import DenseNet169
from keras.preprocessing import image
from keras.models import Model
from keras.layers import Dense, GlobalAveragePooling2D
from keras import backend as K

# 构建不带分类器的预训练模型
base_model = DenseNet169(weights='imagenet', include_top=False)

# 添加全局平均池化层
x = base_model.output
x = GlobalAveragePooling2D()(x)

# 添加一个全连接层
x = Dense(1024, activation='relu')(x)

# 添加一个分类器,假设我们有200个类
predictions = Dense(200, activation='softmax')(x)

# 构建我们需要训练的完整模型
model = Model(inputs=base_model.input, outputs=predictions)
查看模型结构
model.summary()
3. 特征可视化
对每一层卷积核的可视化帮助我们了解算法抽取的特征情况
可以通过keras中的K.function封装输入到输出的函数,获取指定层的输出
# 训练好的模型为model.h5
from keras import backend as K
from keras.models import load_model
import tensorflow as tf

# 加载模型
model_ = load_model('./model.h5')
# 设置为测试阶段
K.set_learning_phase(0)
graph = tf.get_default_graph()

img_file = './test.jpg'
img = cv2.imread(img_file)
img = cv2.resize(img, (224, 224))
img = img.astype('float32')
img = img / 255.0 * 2 - 1
img = np.expand_dims(img, 0)

def get_layer_feat_byname(graph, img, model_, layer_name='conv1/relu'):
    with graph.as_default():
        layer_fn = K.function([model_.layers[0].input, K.learning_phase()], [model_.get_layer(layer_name).output])
        layer_output = layer_fn([img, 0])[0]
        return layer_output

layer_output1 = get_layer_feat_byname(graph, img, model_, 'conv1/relu')
layer_output2 = get_layer_feat_byname(graph, img, model_, 'pool2_conv')
layer_output3 = get_layer_feat_byname(graph, img, model_, 'pool3_conv')
layer_output4 = get_layer_feat_byname(graph, img, model_, 'pool4_conv')
layer_output5 = get_layer_feat_byname(graph, img, model_, 'conv5_block32_concat')
对于densenet169, 我们可以选择每个dense_block层的最后一个concat,也可以选择transition_block pooling前面的卷积层做展示,当然每一个卷积层都是可以做展示的,卷积层名称可以在summary()可以查到。本文 conv1/relu ,pool2_conv,pool3_conv,pool4_conv和最后的conv5_block32_concat
我们看下特征的可视化例子
- 特征可视化:依次是
conv1/relu ,pool2_conv,pool3_conv,pool4_conv和最后的conv5_block32_concat
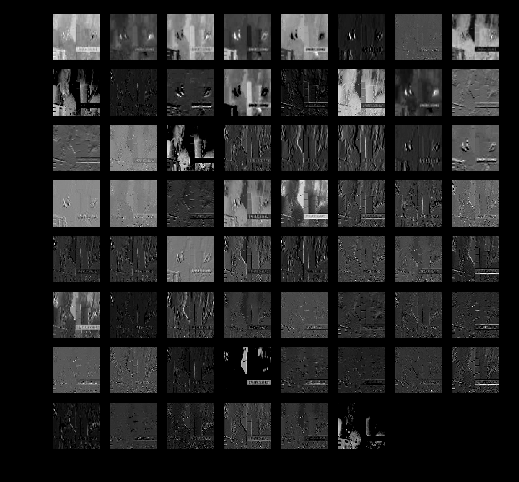
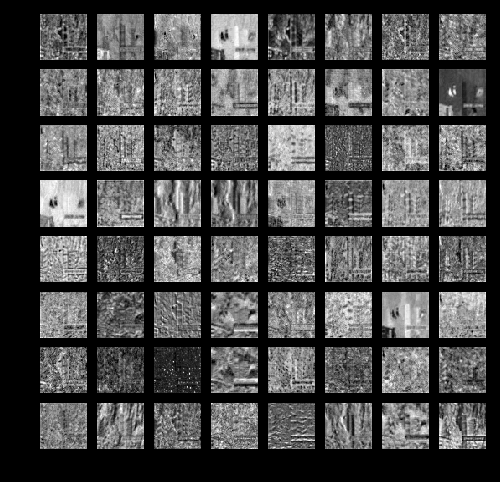
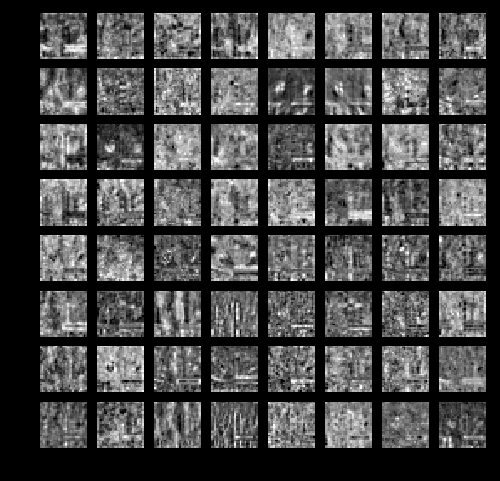
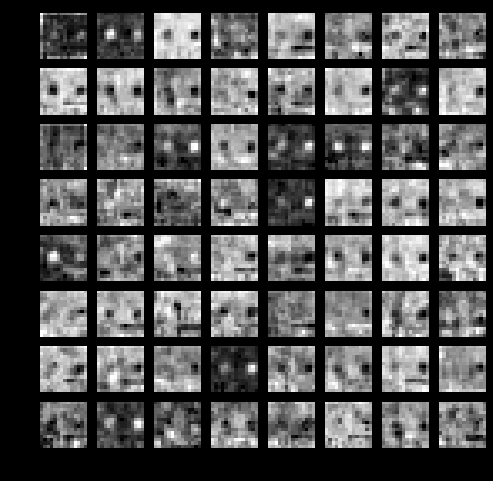
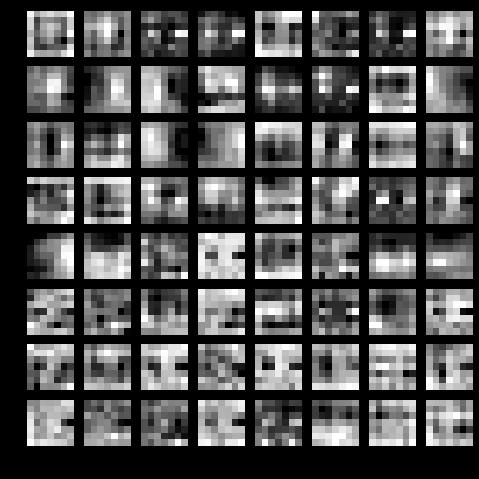
可以看出
- 到最后一层卷积,可以看出模型主要的关注响应点,可以和人为主观上做一个对照,看一下模型识别到的是否目标真正的意图。
- 可以对输入图像做一定处理,比如遮罩掉一部分,看看特征的响应
- 如果看到过多的无用特征,只有少部分特征,可以考虑加下dropout,看是否能提升性能
4. Grad-CAM类激活热力图
由于每一层的特征数较多,只能初略观察下对目标的响应情况。而具体某个类别对应到图片的那个区域响应最大,也就是对该类别的识别贡献最大,没有一个直观的可视化。2016年这篇文章给出了很好的解决方案,而且实现比较简单,Grad-CAM: Visual Explanations from Deep Networks via Gradient-based Localization。
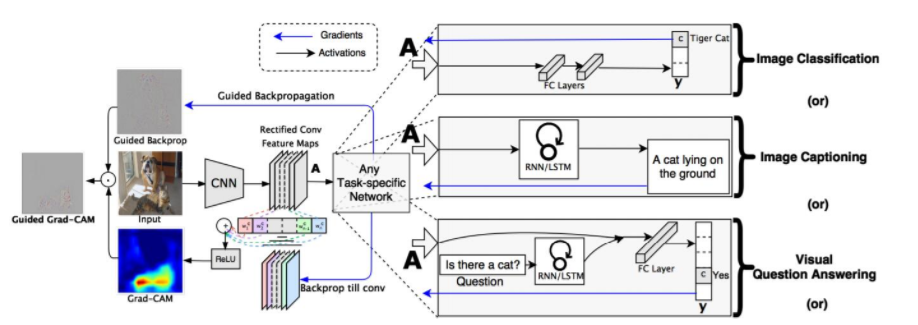
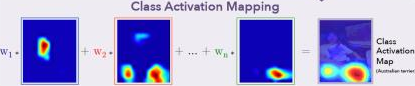
Grad-CAM思想来源CAM(Class Activation Mapping),区别在于计算特征的响应权重不同,CAM采用GAP层后的所有权重,因而CAM必须要有GAP层。而Grad-CAM采用目标类别对特征的梯度来作为响应权重, 对所有网络结构都适用。
过程描述
- 计算目标类别对卷积特征的梯度(可以考虑下梯度的含义, 下降最快,响应最大的)
def output_heatmap(model, last_conv_layer, img):
"""Get the heatmap for image.
Args:
model: keras model.
last_conv_layer: name of last conv layer in the model.
img: processed input image.
Returns:
heatmap: heatmap.
"""
# predict the image class
preds = model.predict(img)
# find the class index
index = np.argmax(preds[0])
print('index: %s' % index)
# This is the entry in the prediction vector
target_output = model.output[:, index]
# get the last conv layer
last_conv_layer = model.get_layer(last_conv_layer)
# compute the gradient of the output feature map with this target class
grads = K.gradients(target_output, last_conv_layer.output)[0]
# mean the gradient over a specific feature map channel
pooled_grads = K.mean(grads, axis=(0, 1, 2))
# this function returns the output of last_conv_layer and grads
# given the input picture
iterate = K.function([model.input], [pooled_grads, last_conv_layer.output[0]])
pooled_grads_value, conv_layer_output_value = iterate([img])
# We multiply each channel in the feature map array
# by "how important this channel is" with regard to the target class
for i in range(conv_layer_output_value.shape[-1]):
conv_layer_output_value[:, :, i] *= pooled_grads_value[i]
# The channel-wise mean of the resulting feature map
# is our heatmap of class activation
heatmap = np.mean(conv_layer_output_value, axis=-1)
heatmap = cv2.resize(heatmap, (img.shape[1], img.shape[2]), cv2.INTER_LINEAR)
heatmap = np.maximum(heatmap, 0)
heatmap /= np.max(heatmap)
print(heatmap.shape)
return heatmap, index
from keras import backend as K
from keras.models import load_model
import tensorflow as tf
import cv2

# 加载模型
model_ = load_model('./model.h5')
# 设置为测试阶段
K.set_learning_phase(0)
graph = tf.get_default_graph()

img_file = './test.jpg'
img = cv2.imread(img_file)
img = cv2.resize(img, (224, 224))
img = img.astype('float32')
img = img / 255.0 * 2 - 1
img = np.expand_dims(img, 0)

heatmap, index = output_heatmap(model_, 'conv5_block32_concat', img)
我们来看一下效果

5. 总结
本文演示了keras在深度学习可视化的两种方式,希望对你有帮助,欢迎交流@mintel。
总结如下
- 使用K.function和model.get_layer 建立模型输入和输出, 进行特征可视化
- Grad-CAM简单高效的类别响应可视化,图像的哪些像素决定了类型输出。关键在于类别输出对特征的梯度


