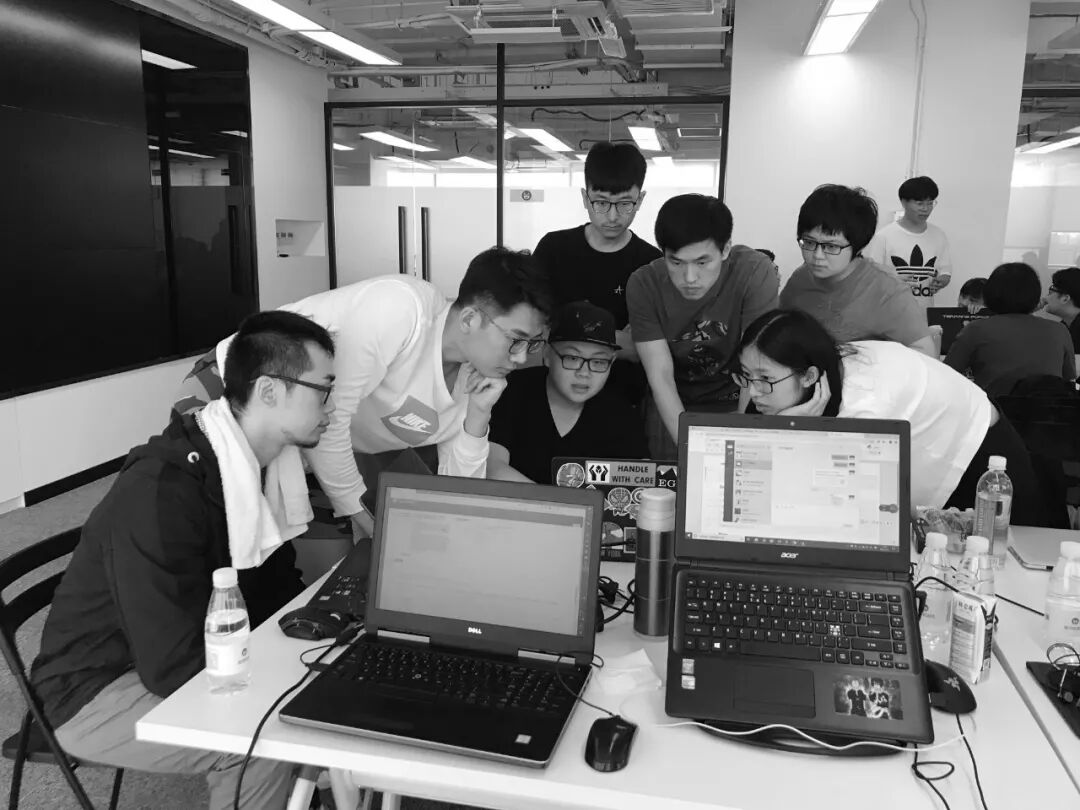
在刚刚结束的的DigitalFUTURES Shanghai 2019上海数字未来暑期工作营中,来自上海的脉策数据科技有限公司(城市数据团)以“亿级数据如何辅助智慧城市决”为题,招募了20多位优秀的小伙伴,完成了主动多元感知城市脉搏、智能规划决策、城市空间价值预测三个主题方向的智慧城市数据研究,并结合大数据管理与可视化系统Datamap,进行了交互式展示。下面小编将与大家分享这一组小伙伴们的工作营成果。
Themed with "Architectural Intelligence", the DigitalFUTURES Shanghai 2019 work shop has come to a great success. The Metrodata team hosted the theme"How Big Data Can help Smart City Decisions", completed 3 urban data researches with over 20 participaters, and presented an interactive display with the support of Datamap, data management and visualization system developed by the company.
TUTORS导师:Ge TANG 汤舸 | Yu YUAN 袁宇 | Jinyu SU 苏敬宇 | Yipei ZHANG 张一培 | Tian RUAN 阮田 | Zongliang FENG 冯宗良 | Jixiao HUANG 黄积小
ASSISTANTS 助教:JialingYANG 杨嘉玲 | Yiyang XU 徐译杨 | CongLIU 刘聪 | Ying HU 胡颖
STUDENTS 学员:YutongCHEN 陈昱同 | Yixuan ZOU 邹怡轩 |Haitao ZHU 朱海涛 | Zhenqi ZHOU 周珍琦 | Xinyu XU 徐欣瑜 | Xuechen WANG 王雪辰 | Xinyue WANG王昕悦 | Huiwang PENG彭惠旺 | Yueheng LU卢玥恒 | Ruijun LIU刘瑞珺 | Mengyuan LI李梦圆 | Wenqi JIA贾文琦 | Kecheng HUANG黄可铖 | Chenyu HUANG黄辰宇 | Rui HE何睿 | Weipeng GUO郭伟鹏 | Yiran FU付一然 | Ming DU杜明 | Zhiqian DENG邓志钱 | Xiangyu CHEN陈翔宇 | Fei XIONG熊非 | Yunjuan SUN孙运娟 | Ziyi TANG 唐子轶
第一组:主动多元感知城市脉搏
Group1:Multi Perception of City Pulse
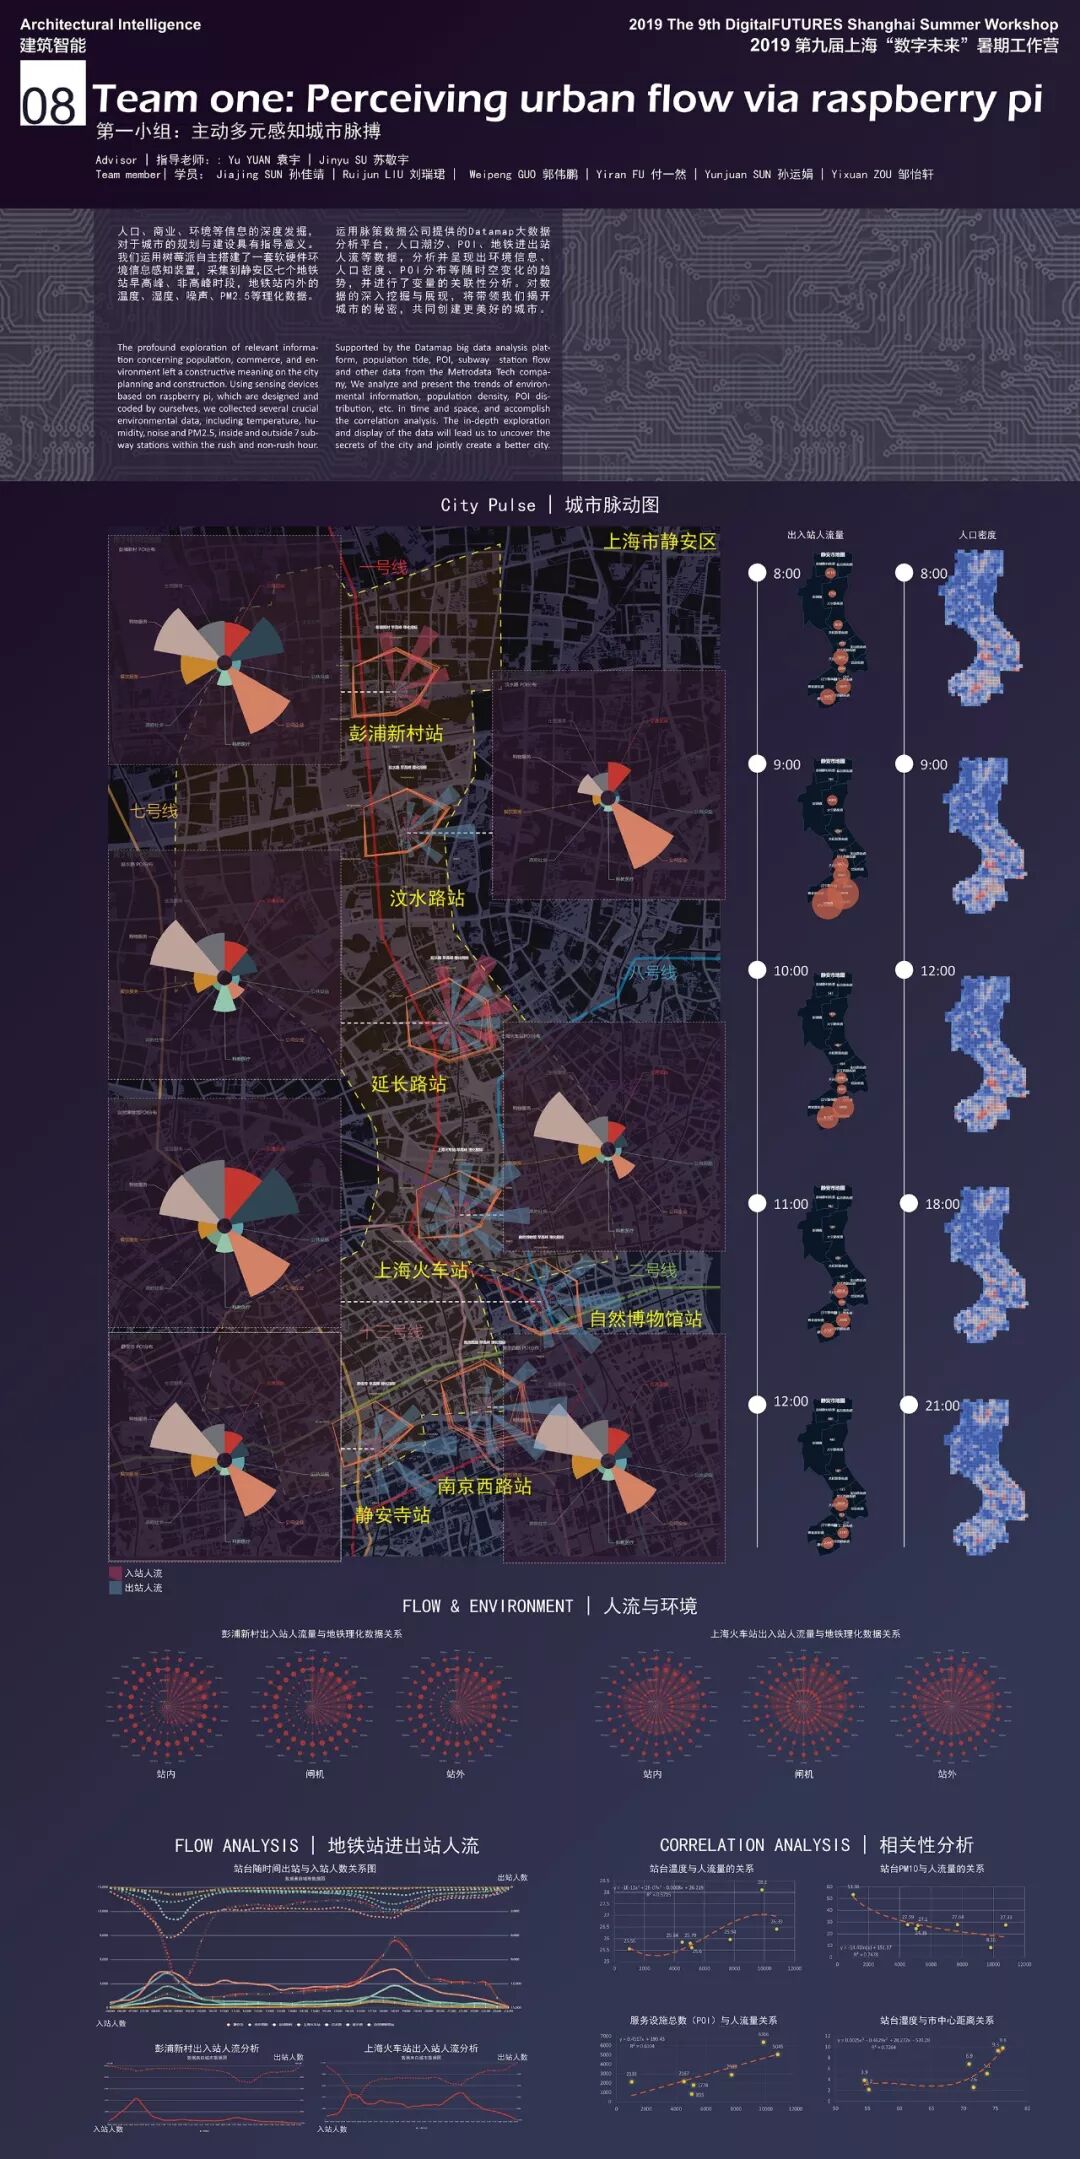
人口、商业、环境等信息的深度发掘,对于城市的规划与建设具有指导意义。第一组的小伙伴运用树莓派自主搭建了一套软硬件环境信息感知装置,采集到静安区七个地铁 站早高峰、非高峰时段,地铁站内外的温度、湿度、噪声、PM2.5等理化数据。
The in-depth exploration of population, business, environment and other information has guiding significance for urban planning and construction. The first group built a set of software and hardware environment information sensing devices with the Raspberry Pi, and collected the temperature, humidity, noise and PM2.5 inside and outside the subway station during the morning peak and off-peak hours ofthe seven subway stations in Jing'an District. Etc.
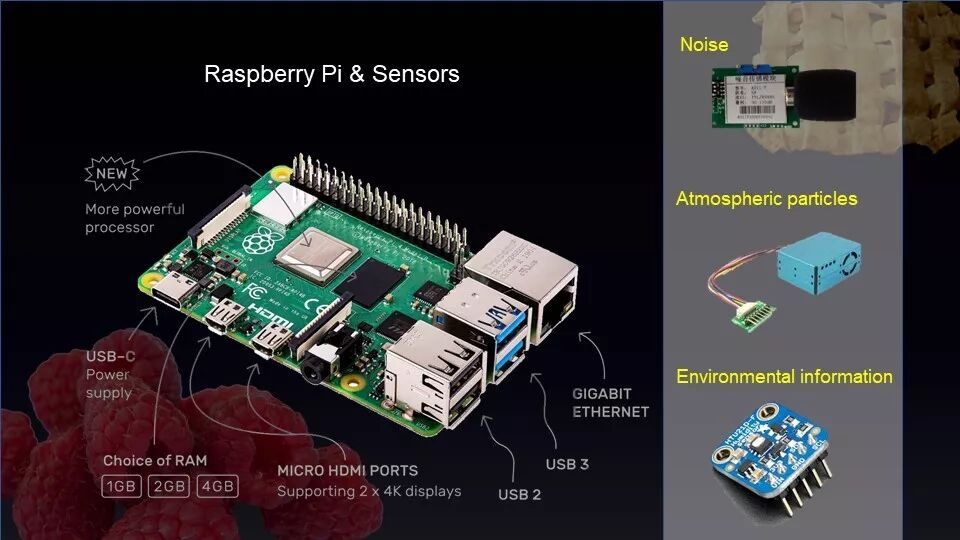
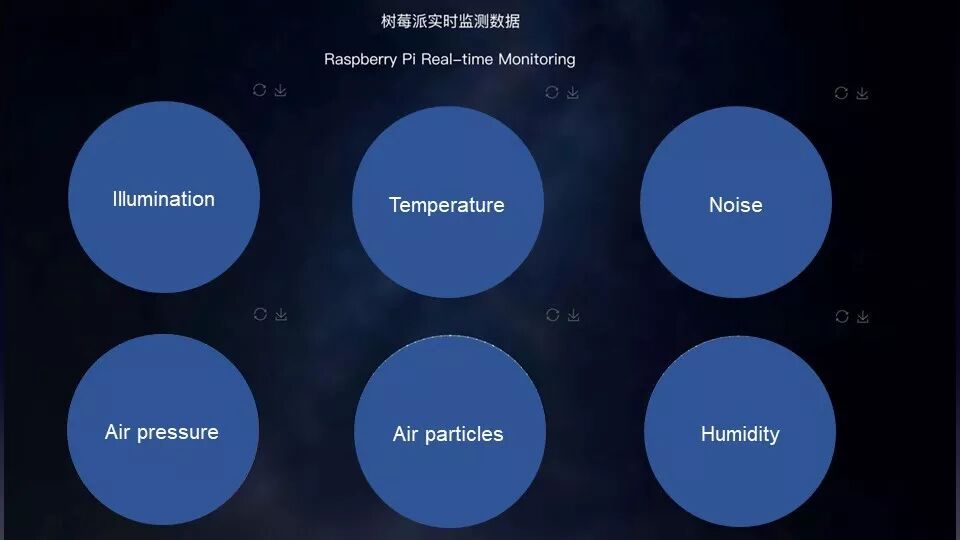
通过树莓派sensor和主板组装机编程,小组得到了7组可以测量环境数据的装置,收集数据字段包括光照、温度、噪声、气压、PM2.5、湿度等。这些数据将被综合评判。
Through the Raspberry Pi sensor and motherboard assembly machine programming, the team got 7 sets of devices that can measure environmental data, collecting data fields including light, temperature, noise, air pressure, PM2.5, humidity and so on. These data will be comprehensively analyzed.
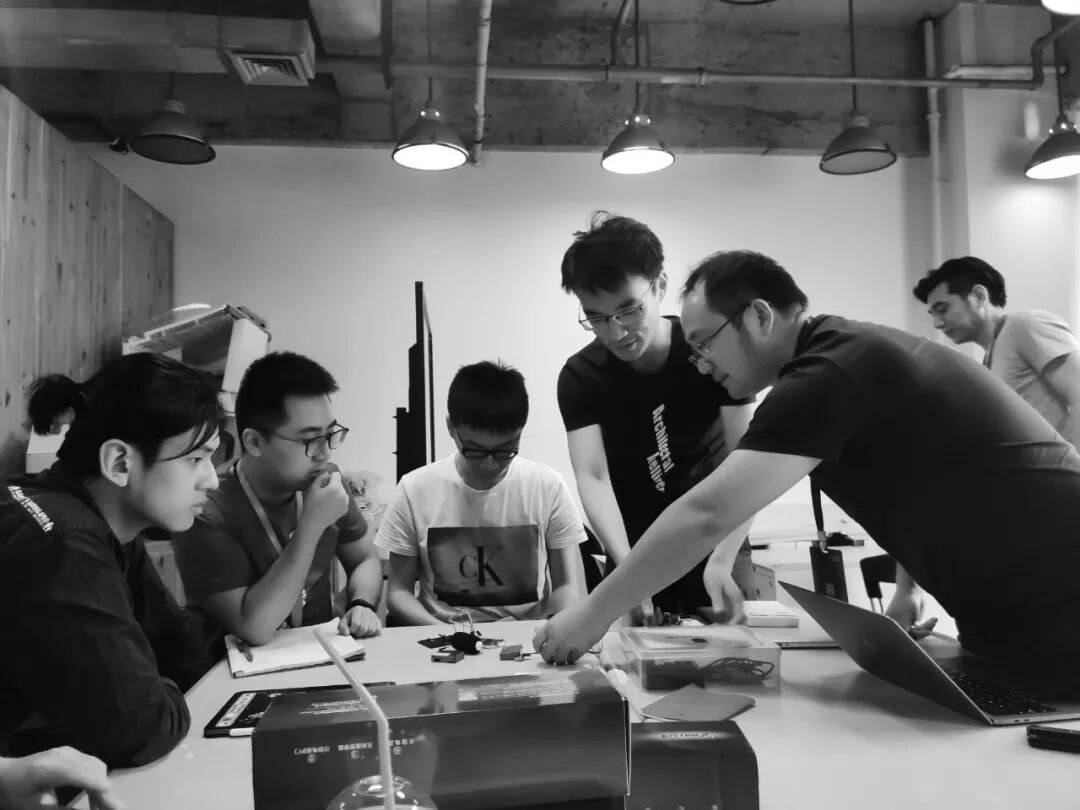
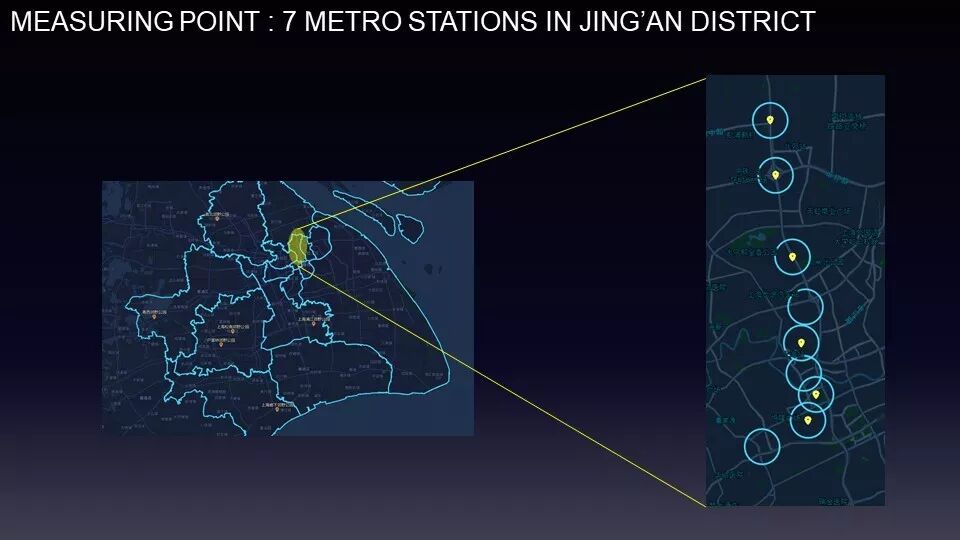
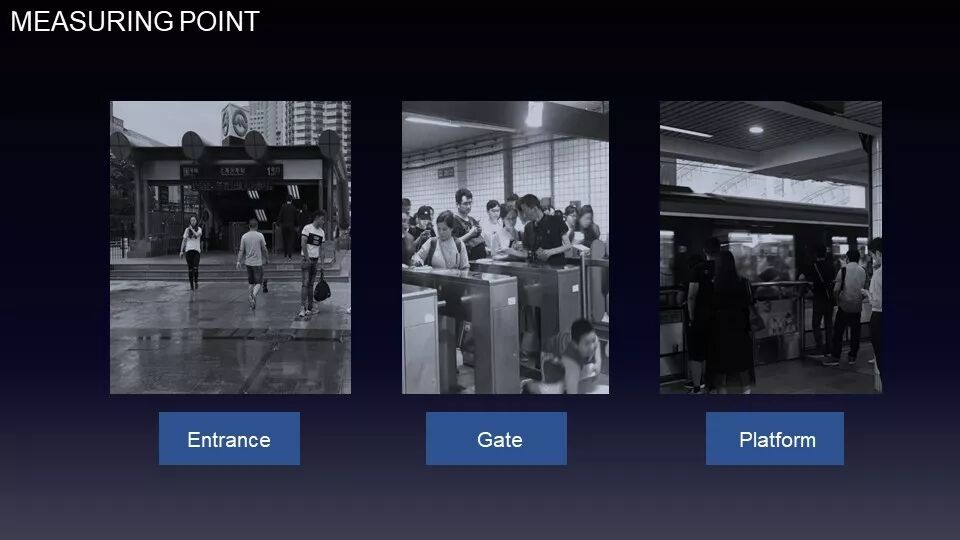
为了在有限时间和有限物料情况下,让成果更有代表性,小组成员选择了静安区的七个地铁站进行测量,并在不同时间段,分别在入口、闸机口、地铁平台进行了树莓派安放。
In order to make the results more representative in the case of limited time and limited materials, the team selected seven subway stations in Jing'an District for measurement, and placed the Raspberry Pi sensors at the entrance, gate, and subway platform at different time periods.
利用脉策数据提供的Datamap平台,第一组的同学实测到的数据放在数据库中,并利用图表、地图、Echarts等功能实现了一组大屏数据可视化成果,使用者可以轻松地通过这个平台查询每个地铁站的实时数据。
The measured data of the first group is placed in the database using the Datamap platform provided by Metrodata,, and a set of large-screen data visualization results are realized by using charts, maps, and Echarts, and the users can easily check the real-time data of each subway station through Datamap.
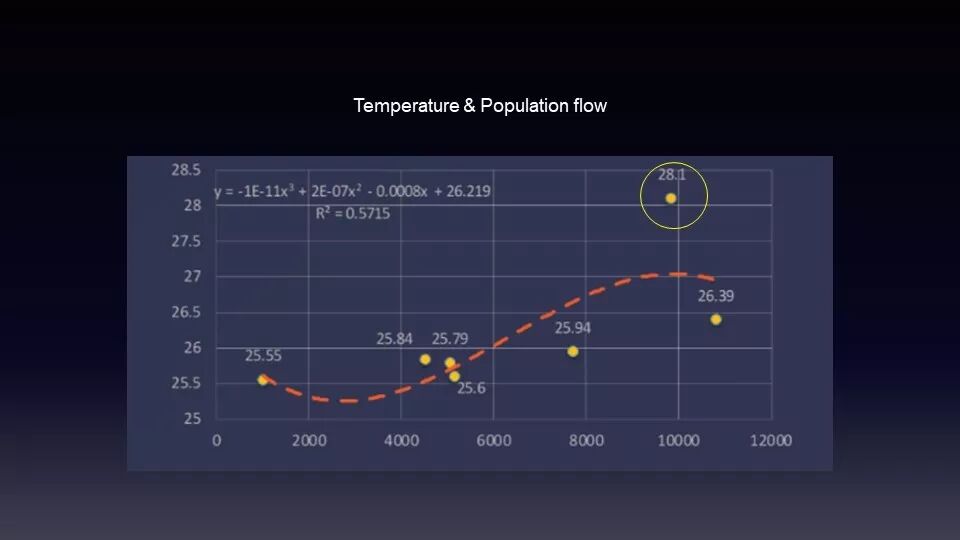
通过地铁站的环境数据监测,同学们也发现了一些有趣的结论。例如温度和人流量一般来说是正相关的,但静安寺站的温度测量值却比预测值高很多,也许下一步,人们可以开始着手研究静安寺温度过高是否有一些设计上的不合理。
Through monitoring the environmental data of the subway station, the students also found some interesting conclusions. For example, temperature and human flow are generally positively correlated, but the temperature measurement at Jing'an Temple is much higher than the predicted value. Next, people can make a research and see whether there is some design irrationality in Jing'an Temple.
最后放上第一组完整的平面作品:
There are Group 1's complete flat works:
第二组:智能规划决策
Group2:Intelligent planning decisions
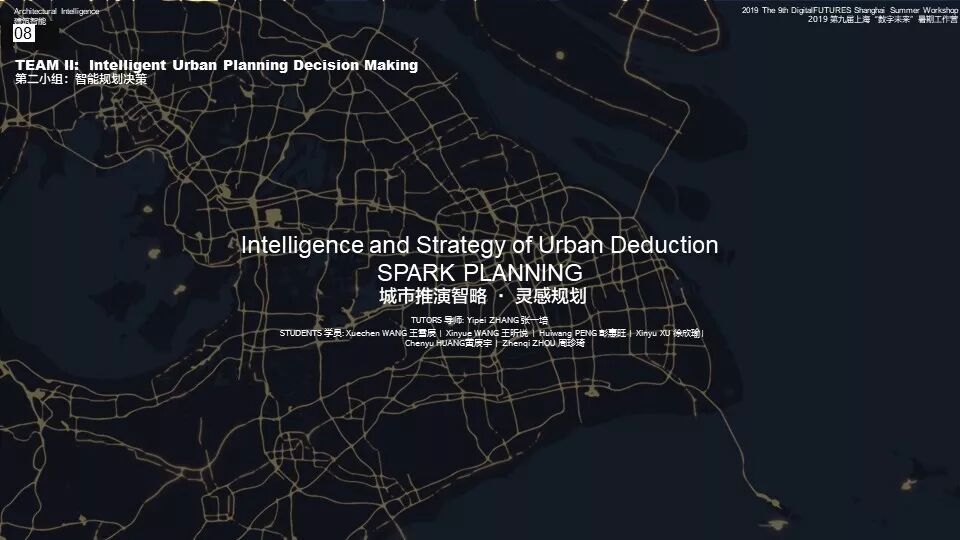
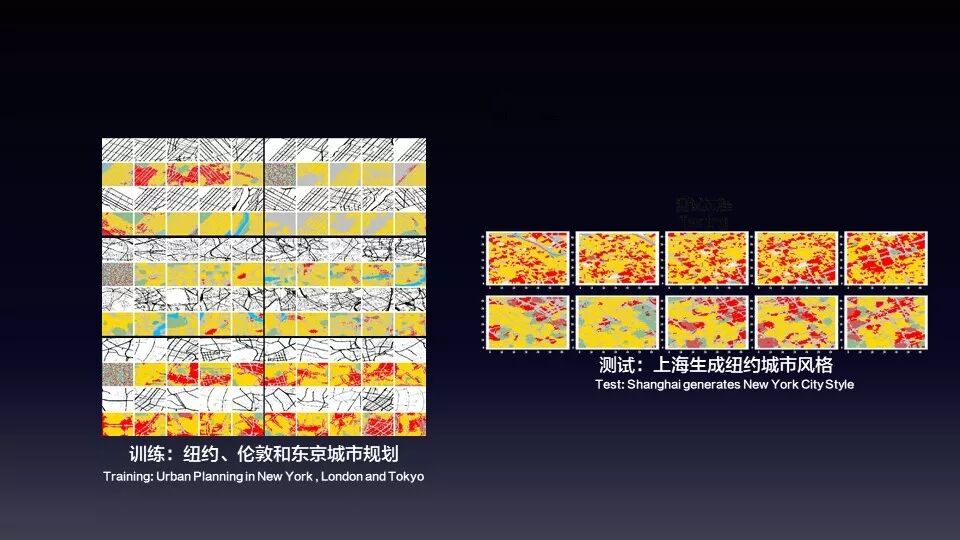
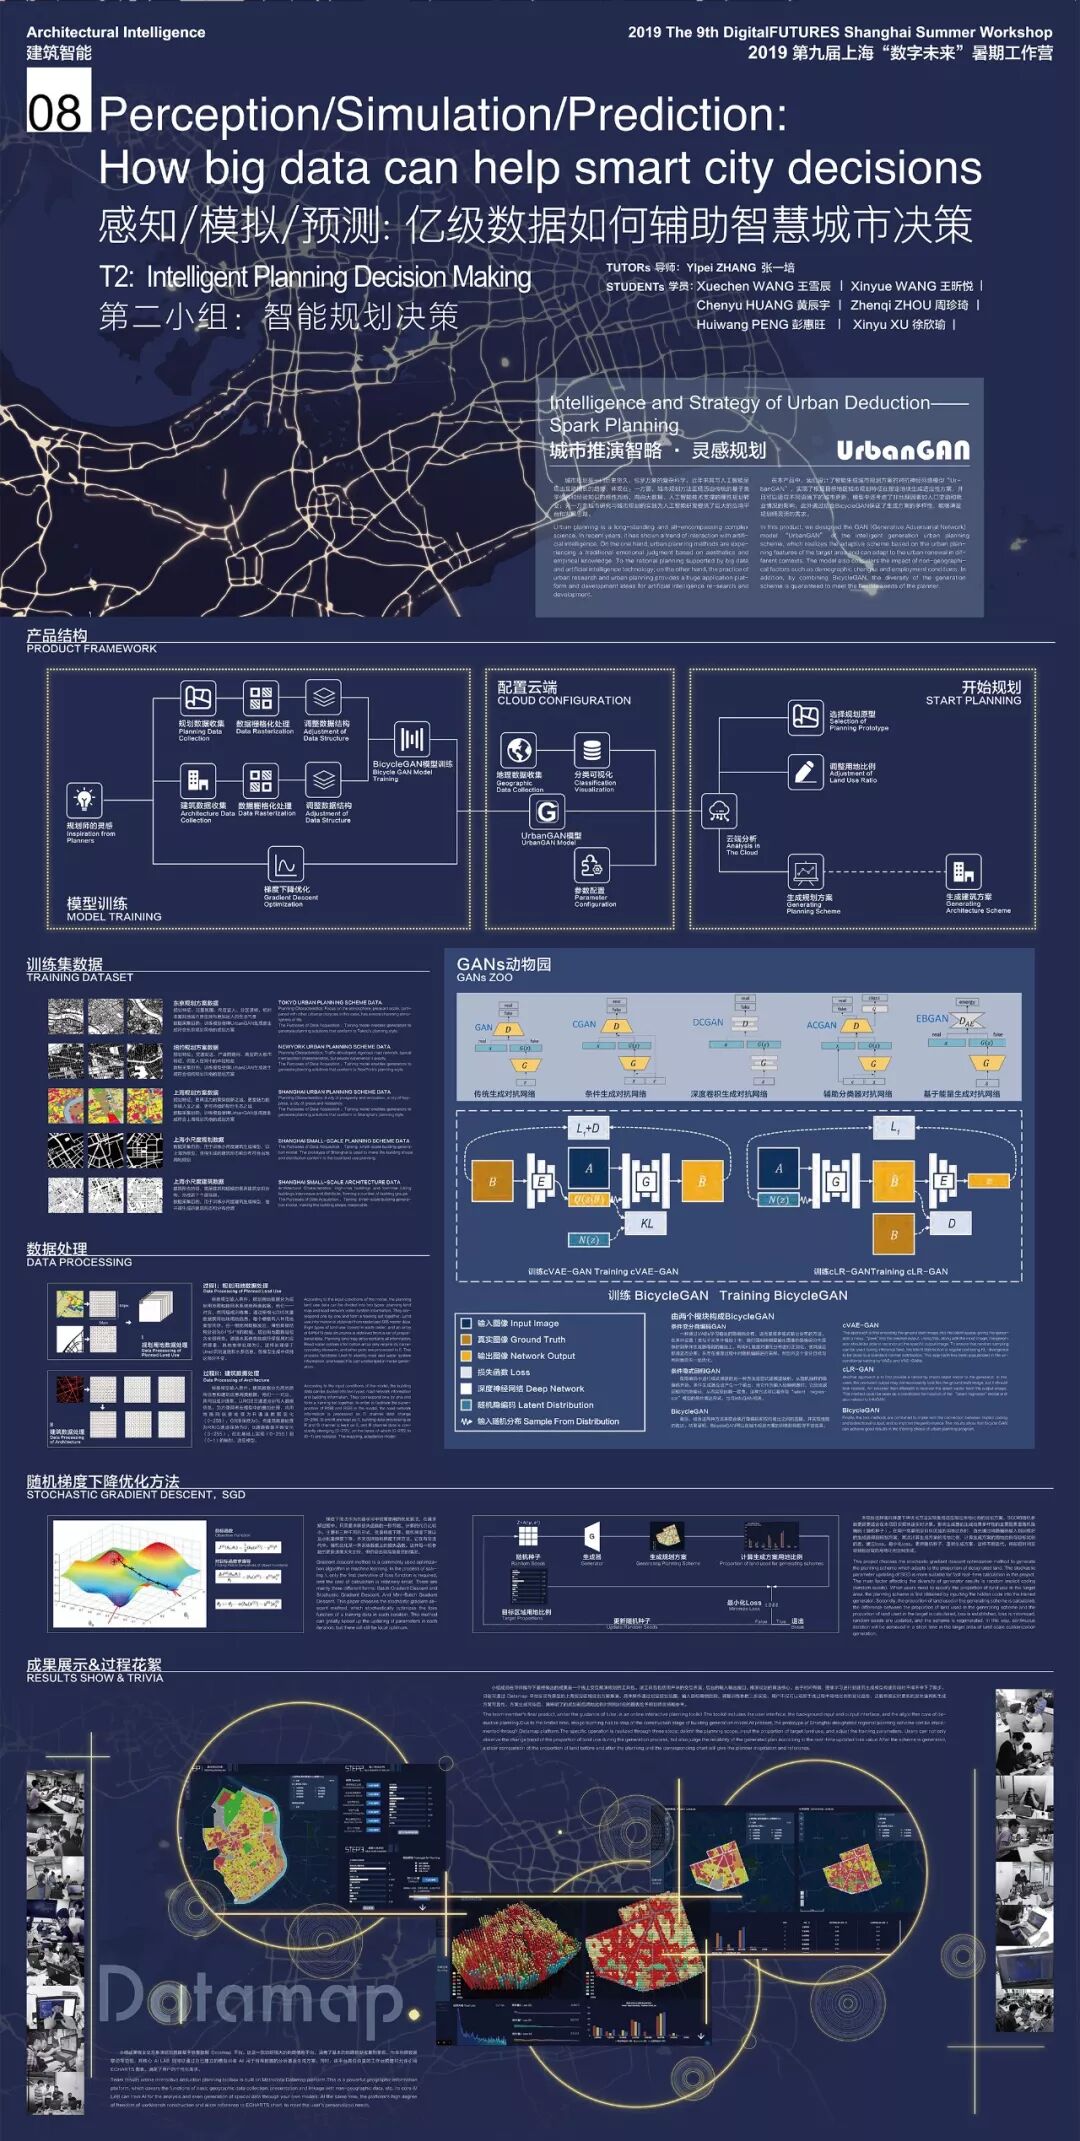
城市规划是一门历史悠久、包罗万象的科学,近年来其与人工智能呈现出互动相长的趋势。第二组设计了智能生成城市规划方案的对抗神经网络模型“UrbanGAN”作为底层算法,考虑非地理因素如人口变动和就业情况的影响,结合 BicycleGAN 的原理保证生成方案的多样性,以此实现根据目标地区城市规划特征在指定地块生成适应性方案,可以适应不同语境下的城市更新,能够满足规划师灵活的需求。并且使用 datamap 作为数据工作平台,将生成规划的结果多角度地呈现出来。
Urban planning is a long-standing and all-encompassing science. In recent years, it has shown a trend of interaction with artificial intelligence. The second group designed the anti-neural network model “UrbanGAN”, which is able to generate intelligent urban planning scheme, as the underlying algorithm, considering the influence of non-geographic factors such as population changes and employment conditions, and combined the principles of BicycleGAN to ensure the diversity of the generation schemes. This will make it possible that adaptive programs are generated in specific blocks according to the urban planning features of the target area, and can adapt to urban renewal in different contexts and meet the flexible needs of planners. Also, they used Datamap as the data work platform to present the results of the generated plan in multiple angles.
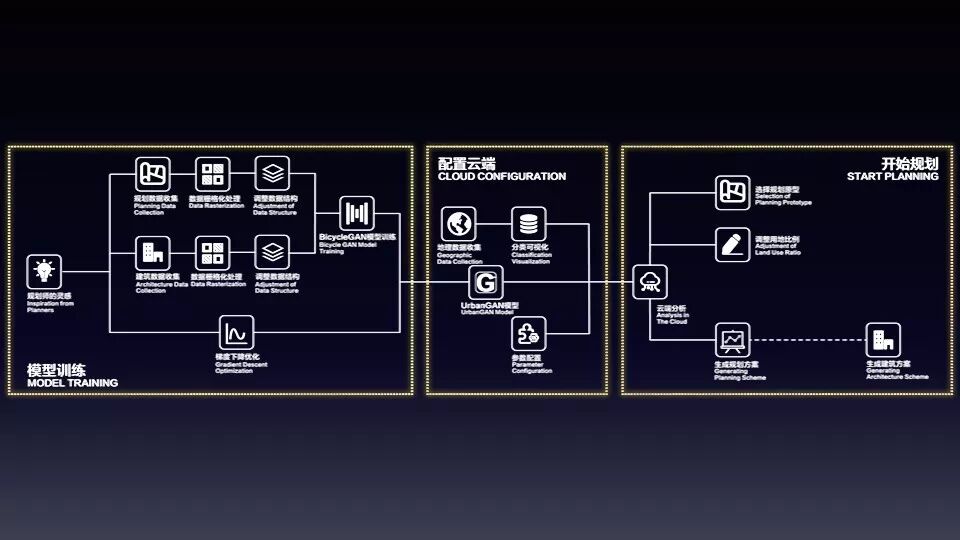
本组的工作主要展示在数据交互网页上,共有三个步骤,实现智能规划决策:
The work of this group is mainly displayed on the data interaction page, there are three steps to achieve intelligent planning decisions:
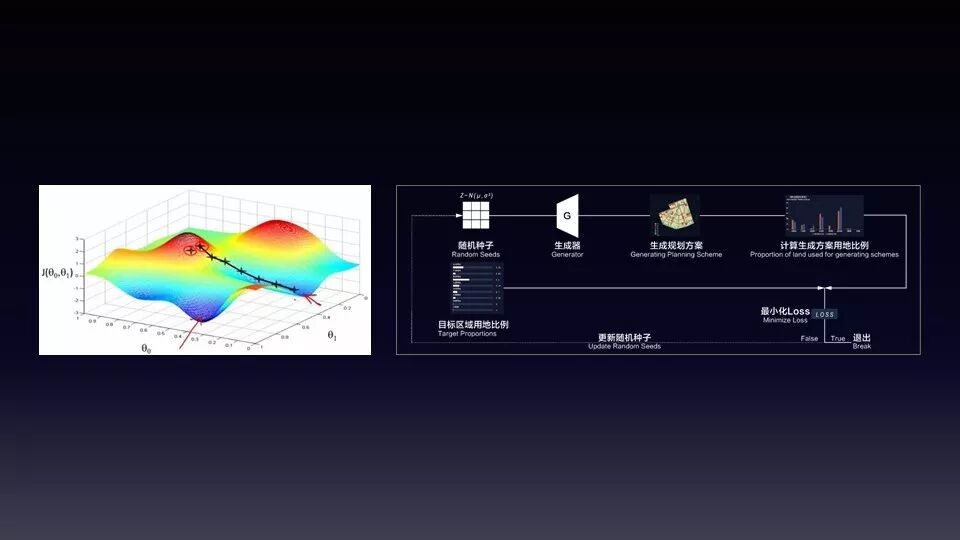
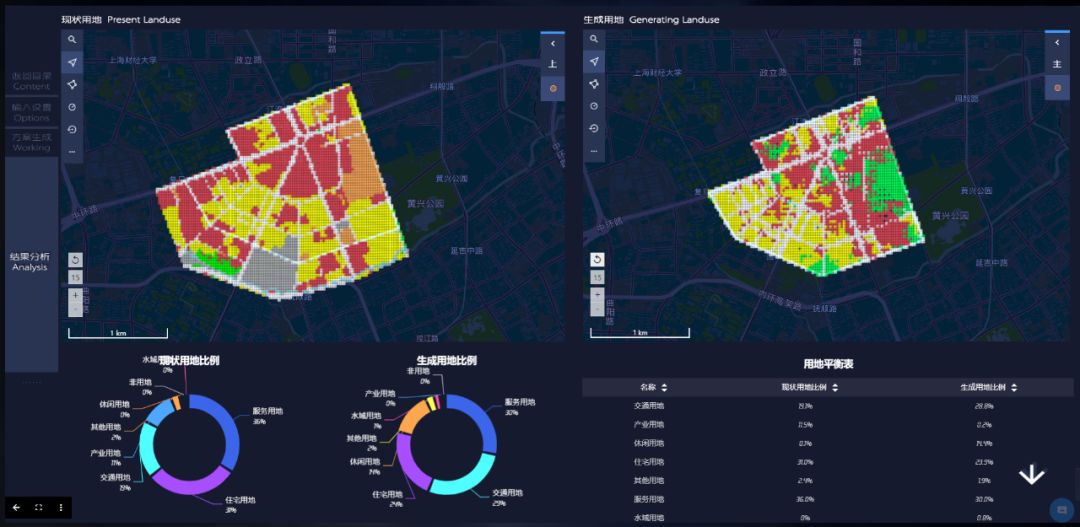
第一步,输入拟定规划范围和用地比例参数,作为模型训练的基础。用户可以在左侧的地图上直接使用选取工具进行范围选择,本文展示的案例是五角场地区的规划生成。屏幕右上方为用地比例模块,目前共有八类用地,用户可以通过拉动滑块来确定规划中的理想用地比例,也可以使用目前已有的六类规划样例:“活力大学城”、“商业商务中心”、“科创产业园”、“生态养老社区”、“商贸物流工业园”、“生态旅游度假村”。
第二步,点击开始分析后,Datamap后台将进行参数计算,自动生成选定区域的规划设计。屏幕左上方模块为城市规划方案生成过程的立体图,右上方为对应规划方案生成过程的平面图。左下方是 Loss 损失函数的变化曲线(Loss 函数值越低,变化越稳定就说明模型越理想),右下方柱状图反映不同用地比例(现状与生成规划情况)。
In the second step, after clicking Start Analysis, the Datamap will start parameter calculation and generate the planning design of the selected area automatically. The upper left part of the screen is a perspective view of the urban planning scheme generation process, and the upper right is the plan view corresponding to theplanning scheme generation process. At the bottom left is the variation curve of the Loss function (the lower and more stable the Loss function value is, the more ideal the model can be), and the lower right histogram reflects different landuse ratio(status and generation planning).
第三步,查看结果。在此页面,用户可以看到生成规划方案的最终结果呈现,包括不同用地最终比例,以及人口密度分布。
The third step is to view the results. On this page, users can see the final results of the generated planning scenario, including the final different land use ratio, and the population density distribution.
最后放上第二组完整的平面作品:
These are the completegraphic works of Group 2:
第三组:城市空间价值预测
Group 3:Urban space value prediction
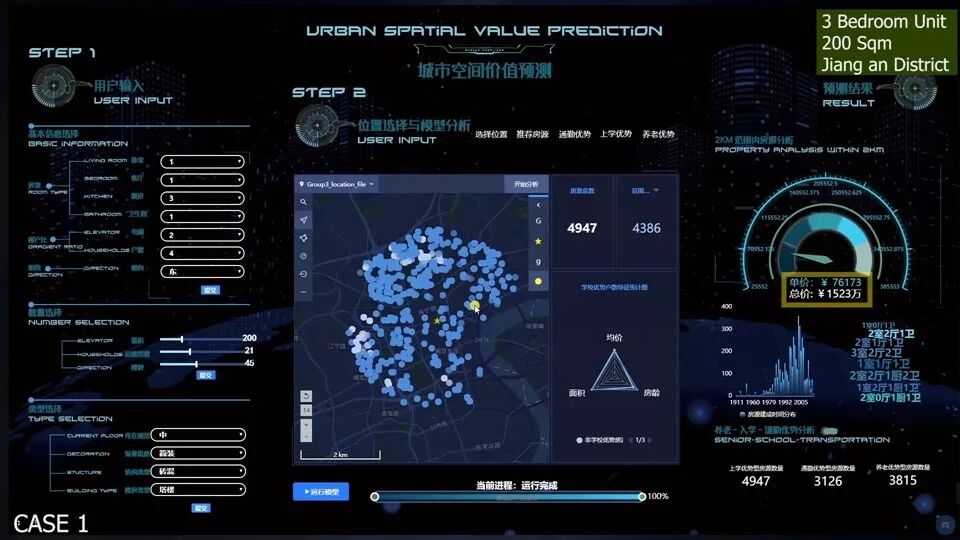
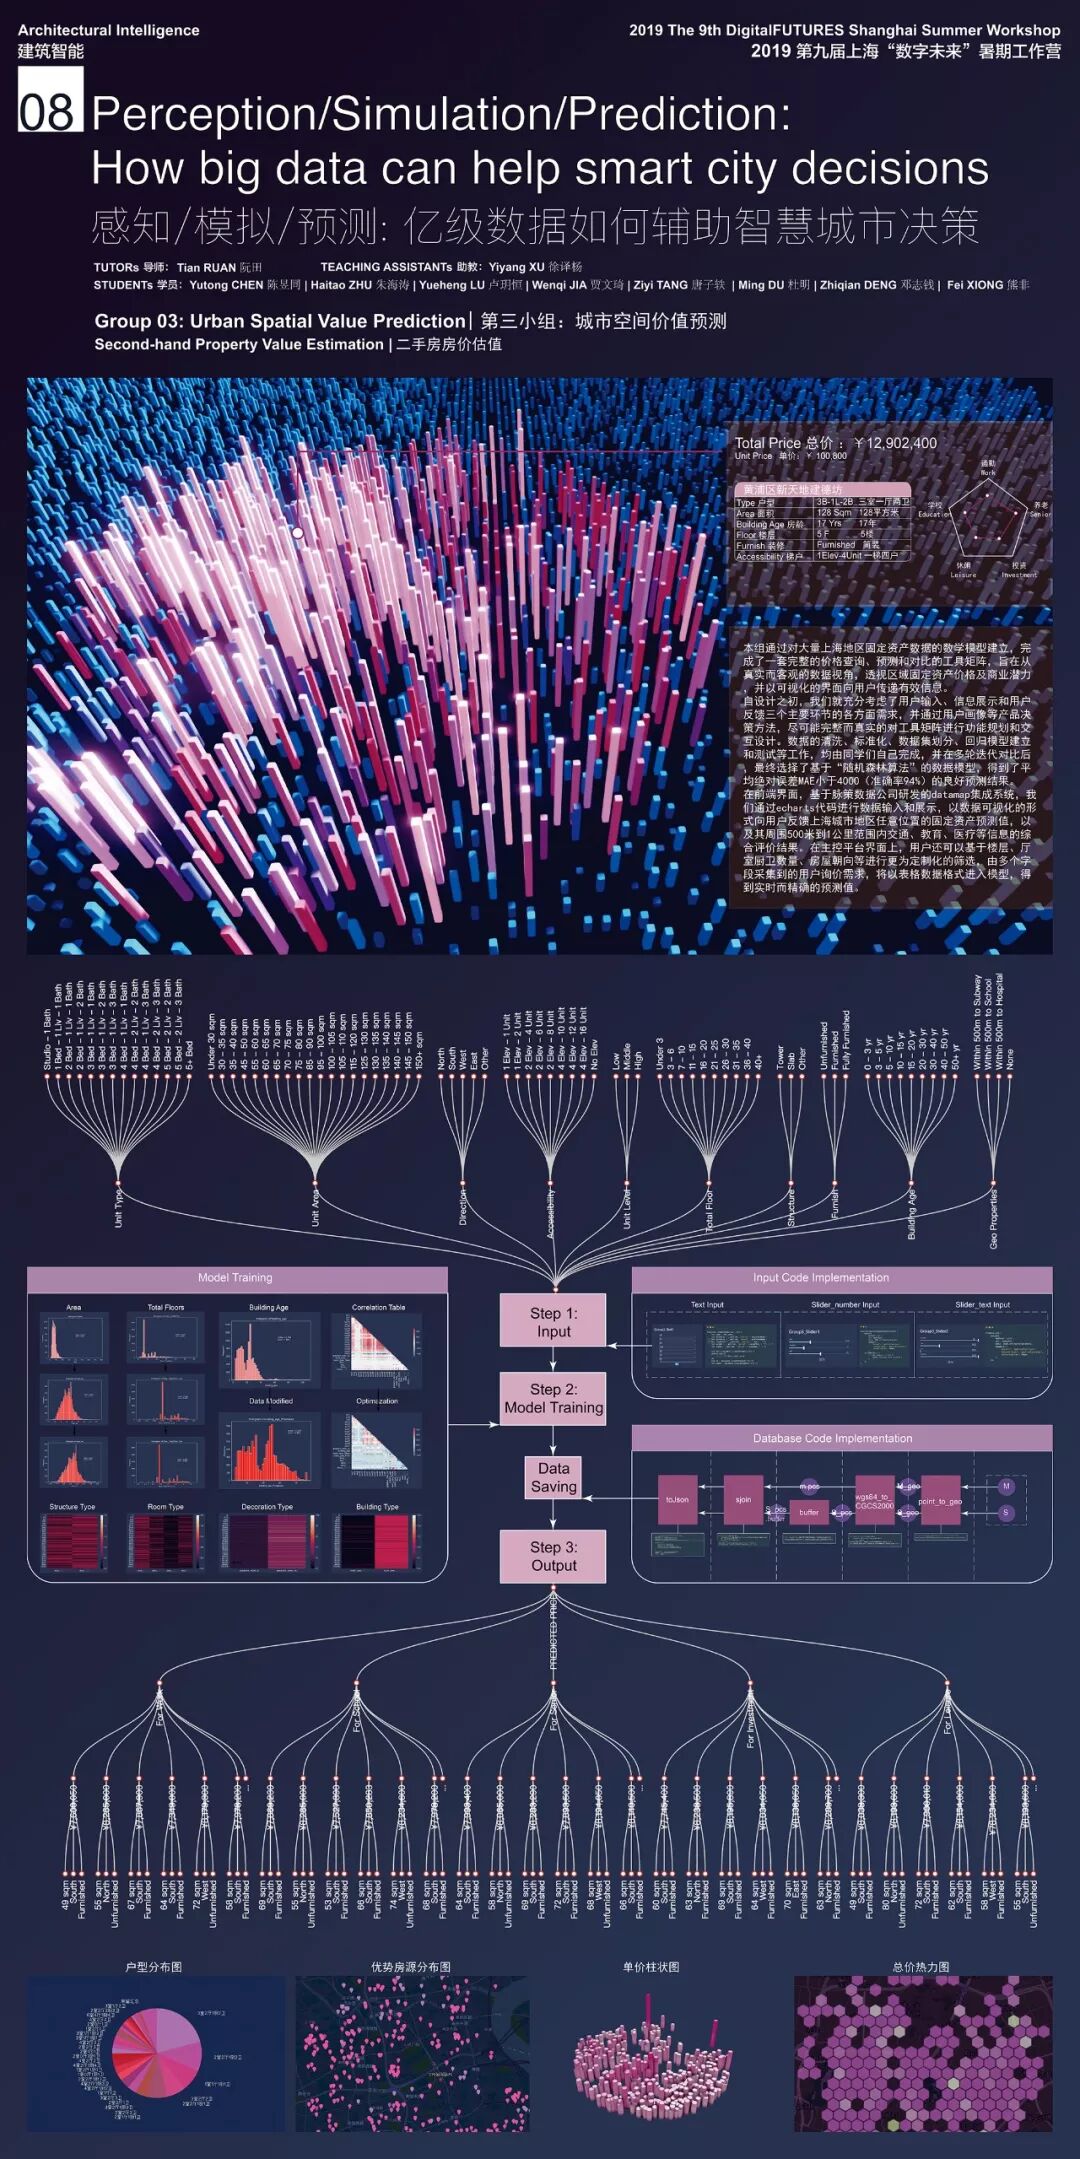
本组通过对大量上海地区固定资产数据的数学模型建立,完成了一套完整的价格查询、预测和对比的工具矩阵,旨在从真实而客观的数据视角,透视区域固定资产价格及商业潜力,并以可视化的界面向用户传递有效信息。
Through the establishment of a mathematical model of a large number of fixed asset data in Shanghai, the group completed a complete tool matrix for price inquiry, forecasting and comparison, aiming at the perspecting regional fixed asset prices and commercial potential from a realistic and objective data perspective, and present effective information to the users with a visual interface.
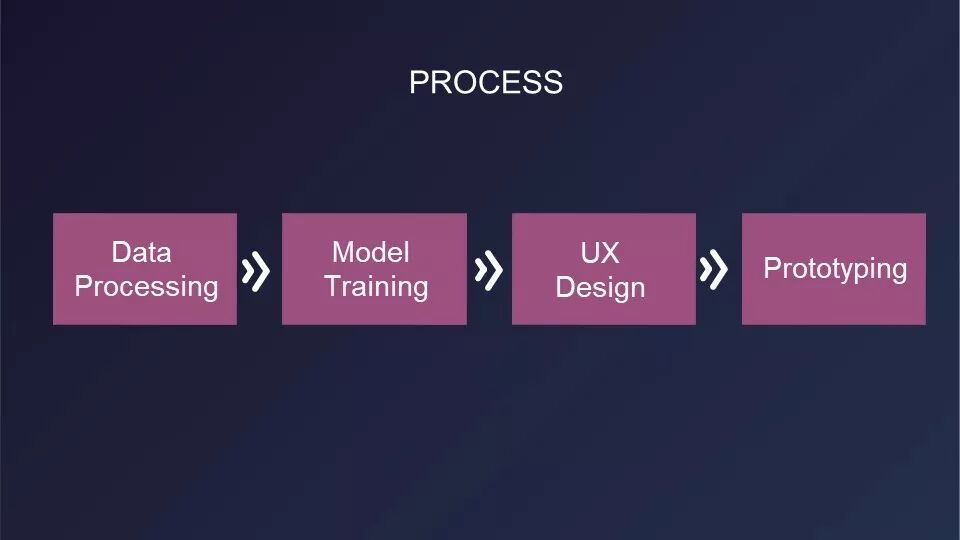
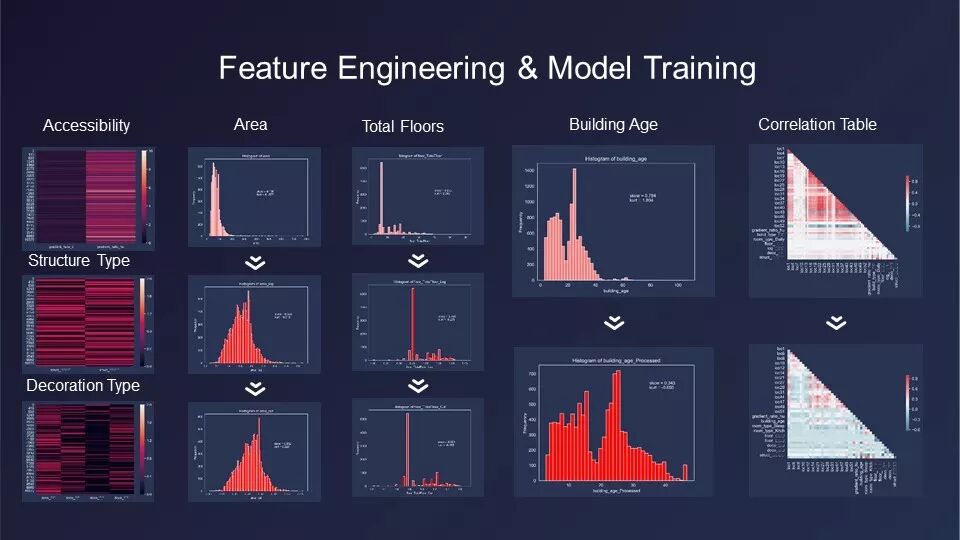
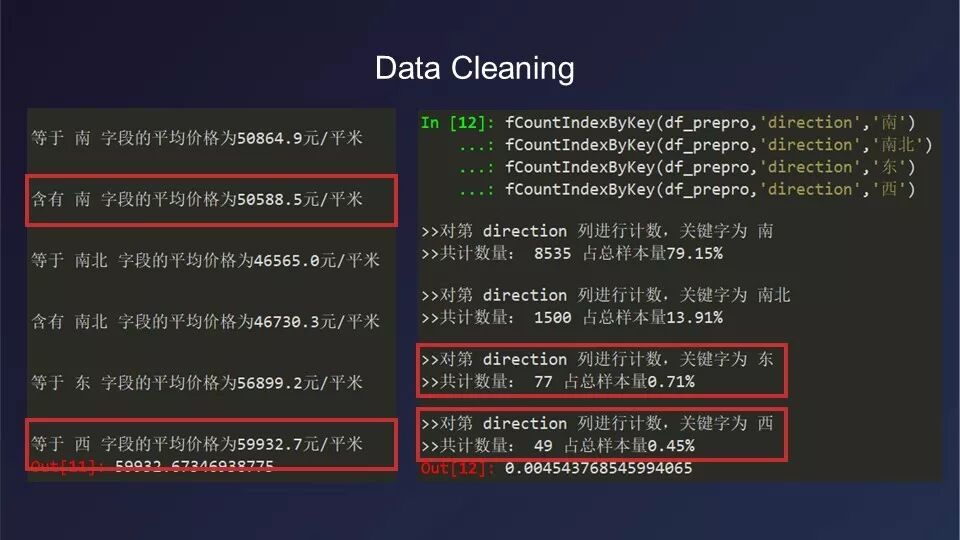
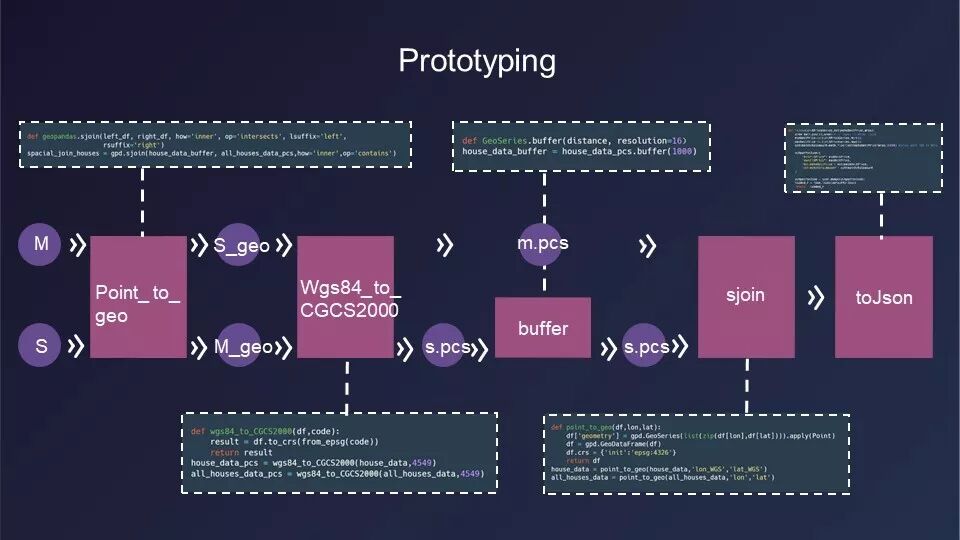
自设计之初,本组就充分考虑了用户输入、信息展示和用户反馈三个主要环节的各方面需求,并通过用户画像等产品决策方法,尽可能完整而真实的对工具矩阵进行功能规划和交互设计。数据的清洗、标准化、数据集划分、回归模型建立和测试等工作,均由同学们自己完成,并在多轮迭代对比后,最终选择了基于“随机森林算法”的数据模型,得到了平均绝对误差MAE小于4000(准确率94%)的良好预测结果。
Since the beginning of the design, the group has fully considered the various requirements of the three main links: user input, information display and user feedback, and through the product decision-making methods such as user portraits, they tried to make the functional planning and interactive design of the tool matrix comlete. Data cleaning, data standardization, data set division, regression model establishment and testing were all completed by the students themselves. After multiple rounds of iterative comparison, the data model based on “random forest algorithm” was selected, and good prediction results with an error MAE of less than 4000 (accuracy rate of 94%) was obtained.
在前端界面,基于脉策数据公司研发的datamap集成系统,组员们通过echarts代码进行数据输入和展示,以数据可视化的形式向用户反馈上海城市地区任意位置的固定资产预测值,以及其周围500米到1公里范围内交通、教育、医疗等信息的综合评价结果。
In the front-end interface, based on Datamap, the integration system developed by Metrodata, the team members input and displayed data through the echarts code, and present the fixed asset forecast value of any location in Shanghai to the users in the form of data visualization, together with comprehensive evalutation results of information on transportation, education, medical care, etc, with the range of 500m-1000m around.
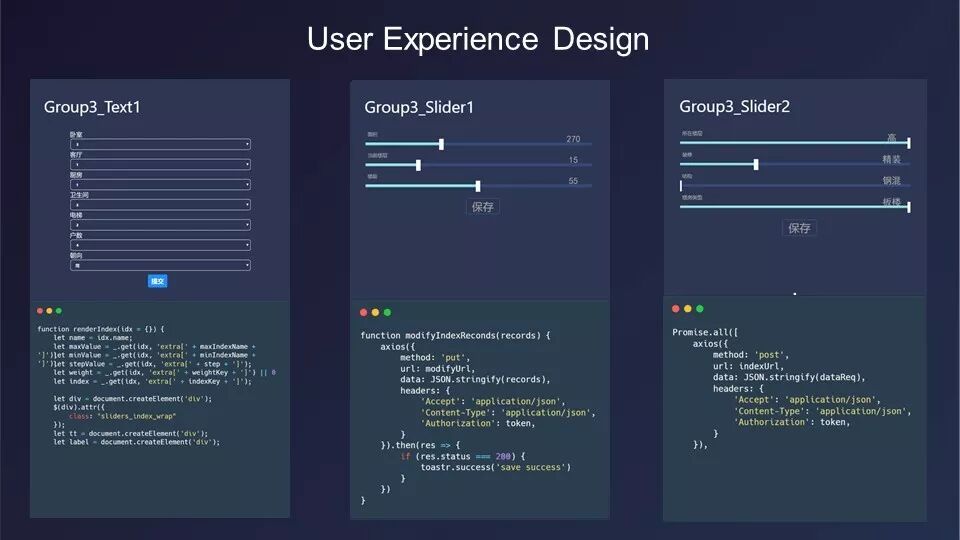
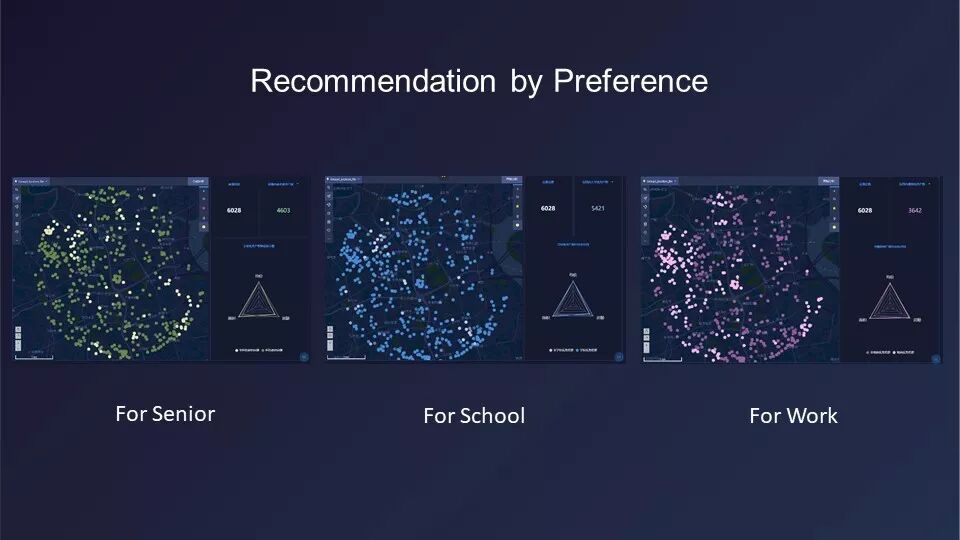
在主控平台界面上,用户还可以基于楼层、厅室厨卫数量、房屋朝向等进行更为定制化的筛选,由多字段采集到的用户询价需求,将以表格数据格式进入模型,得到实时而精确的预测值。在机器学习的加持下,用户不仅能轻而易举的找到符合自身要求的有潜力的不动产,还能找到2km范围内所有符合条件区间的不动产。
On the interface of the main control platform, users can also conduct more customized screening based on the number of floors, kitchen and bathroom, and the orientation of the house. The user inquiry requirements collected by multiple fields will enter the model in tabular data format,since obtaining real-time and accurate prediction. Under the support of machine learning, users can not only find potential real estate that meets their own requirements, but also find all real estates within the 2km range.
最后放上第三组完整的平面作品:
These are the complete flat works of Group 3.
亿级数据如何辅助智慧城市决策
视频展示及过程记录
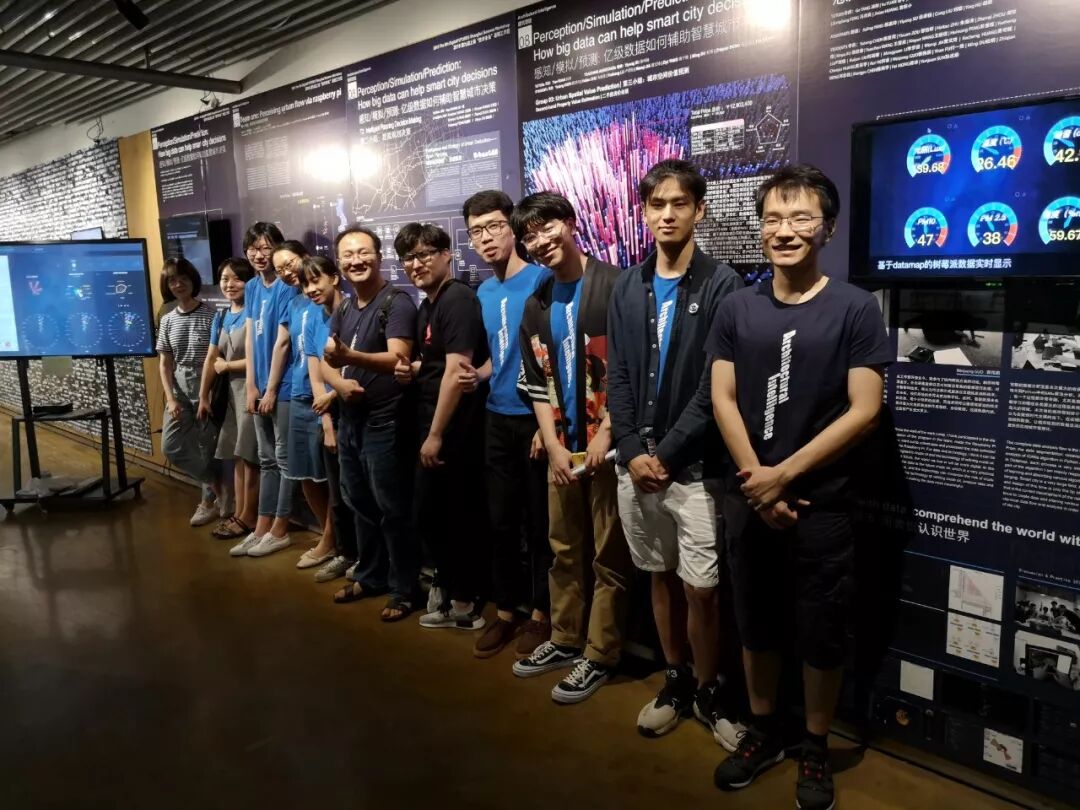
目前第八组的研究内容及交互大屏Datamap在在同济大学建筑城规学院C楼负一层展厅展出。欢迎大家前去参观。
Researches and large screen Datamap are now exhibited in the exhibition hall on ground floor of Building C in College of Architecture and Urban Planning, Tongji University. Looking forward to your visit.DigitalFUTURES Shanghai 2019
主办单位
同济大学
联合主办单位
中国建筑学会 计算性设计学术委员会
中国建筑学会 数字建造学术委员会
全国高等院校建筑学科专业指导委员会建筑数字技术教学工作委员会
同济大学建筑设计研究院(集团)有限公司
承办单位
同济大学建筑与城市规划学院
上海建筑数字建造工程技术研究中心
协办单位
同济大学本科生院
支持单位
一造科技
DADA
全筑股份
支持媒体
建筑学报 | 时代建筑 | 世界建筑 | Architecture China | 西部人居环境学刊 | 南方建筑 | 建筑技艺 | 建筑实践 | 有方 | 谷德设计网 | ArchDaily | Dezeen
1. Making cities smarterHow citizens' collective intelligence can guide better decision making
2. Forces of change: Smart cities;
3. The Real-Time City? Big Data and Smart Urbanism;5. 智慧城市,可以实现的人类乌托邦,三联生活周刊;
FAB-UNION is the most advanced dig
ital design and construction platform in China. Scholars, architects, designers, experts and relevant enterprises, institutions and academic groups of digital construction both inside and outside the United Nations pay attention to international digital design and construction news, recommend excellent digital programming and construction works, and promote the development of digital construction technology. Create social space for cutting-edge digital practitioners.


