
来源 | 转载自修炼 Python(ID:yetingyun_python)

前言
数据来源:https://www.zhenai.com/zhenghun/
本文利用 Python 分析了按城市寻找所有地区的征婚信息,看看相亲男女的画像。

import pandas as pdimport re
df = pd.read_excel('marriage.xlsx')df.head()
获取到的数据里,居住地是各地区的,为了便于分析,需要处理成省级行政区,学历/月薪那一列数据,有些是月薪,有些是学历,可以分别处理成两列数据,是学历的,提取出学历层次,月薪标记为 “未知”;是月薪的,提取出月薪并计算,学历标记为 “未知”。

with open('地区.txt', 'r', encoding='utf-8') as f: area = f.read().split('\n')
print(area)print(len(area))
['北京', '上海', '天津', '重庆', '黑龙江', '吉林', '辽宁', '内蒙古', '河北', '新疆', '甘肃', '青海', '陕西', '宁夏', '河南', '山东', '山西', '安徽', '湖北', '湖南', '江苏', '四川', '贵州', '云南', '广西', '西藏', '浙江', '江西', '广东', '福建', '台湾', '海南', '香港', '澳门']34
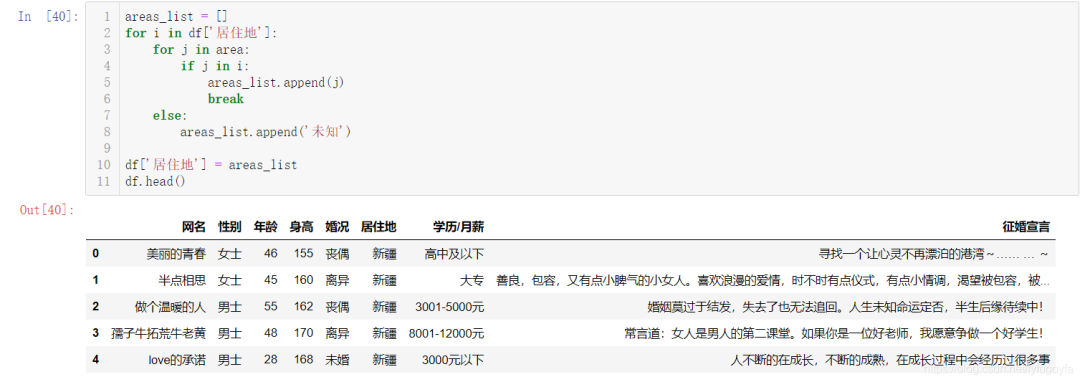
areas_list = []for i in df['居住地']: for j in area: if j in i: areas_list.append(j) break else: areas_list.append('未知')
df['居住地'] = areas_listdf.head()
结果如下:
with open('学历.txt', 'r', encoding='utf-8') as fp:    edu = fp.read().split('\n')
print(edu)
['博士', '硕士', '本科', '大专', '中专', '高中', '初中', '小学']
salary_list = []edu_list = []for item in df['学历/月薪']:    if '元' in item:   # 这一列的数据是表达月薪的话  计算        data = re.findall('\d+', item)        data = [int(x) for x in data]        salary = int(sum(data) / len(data))  # 取整        salary_list.append(salary)        edu_list.append('未知')    else:        salary_list.append('未知')        for e in edu:            if e in item:                edu_list.append(e)                break        else:            edu_list.append('未知')
print(len(edu_list))print(len(salary_list))df['学历'] = edu_listdf['月薪'] = salary_listdf.head()
结果如下:
 这时候数据处理好了,可以删掉学历/月薪这一列,再重新保存到Excel。
df.to_excel('处理后数据.xlsx', index=False)

数据分析
"""@File :男女占比情况.py@Author :叶庭云@CSDN :https://yetingyun.blog.csdn.net/"""import pandas as pdimport collectionsfrom pyecharts.charts import Piefrom pyecharts import options as optsfrom pyecharts.globals import ThemeType, CurrentConfig
CurrentConfig.ONLINE_HOST = 'D:/python/pyecharts-assets-master/assets/'df = pd.read_excel('处理后数据.xlsx')gender = list(df['性别'])gender_count = collections.Counter(gender).most_common()gender_count = [(k, v) for k, v in gender_count]
pie = Pie(init_opts=opts.InitOpts(theme=ThemeType.MACARONS))pie.add('性别', data_pair=gender_count, radius=["40%", "55%"], label_opts=opts.LabelOpts( position="outside", formatter="{a|{a}}{abg|}\n{hr|}\n {b|{b}: }{c} {per|{d}%} ", background_color="#eee", border_color="#aaa", border_width=1, border_radius=4, rich={ "a": {"color": "#999", "lineHeight": 22, "align": "center"}, "abg": { "backgroundColor": "#e3e3e3", "width": "100%", "align": "right", "height": 22, "borderRadius": [4, 4, 0, 0], }, "hr": { "borderColor": "#aaa", "width": "100%", "borderWidth": 0.5, "height": 0, }, "b": {"fontSize": 16, "lineHeight": 33}, "per": {
"color": "#eee", "backgroundColor": "#334455", "padding": [2, 4], "borderRadius": 2, }, }, ),)pie.set_global_opts(title_opts=opts.TitleOpts(title='相亲男女占比情况'))pie.set_colors(['red', 'blue']) pie.render('男女占比情况.html')
相亲男女中男士有 25910 人,占比 45.72%;女士有 30767 人,占比 54.28%。参加相亲人数中女士多于男士。"""@File :年龄分布.py@Author :叶庭云@CSDN :https://yetingyun.blog.csdn.net/"""import pandas as pdimport collectionsfrom pyecharts.charts import Barfrom pyecharts.globals import ThemeType, CurrentConfigfrom pyecharts import options as opts
CurrentConfig.ONLINE_HOST = 'D:/python/pyecharts-assets-master/assets/'
df = pd.read_excel('处理后数据.xlsx')age = list(df['年龄'])age_count = collections.Counter(age).most_common()age_count.sort(key=lambda x: x[0])age = [x[0] for x in age_count]nums = [y[1] for y in age_count]
bar = Bar(init_opts=opts.InitOpts(theme=ThemeType.MACARONS))bar.add_xaxis(age)bar.add_yaxis('人数', nums) bar.set_global_opts(title_opts=opts.TitleOpts(title='相亲男女年龄分布'))bar.set_series_opts(label_opts=opts.LabelOpts(is_show=False), markpoint_opts=opts.MarkPointOpts( data=[ opts.MarkPointItem(type_="max", name="最大值"), opts.MarkPointItem(type_="min", name="最小值"), opts.MarkPointItem(type_="average", name="平均值")]), markline_opts=opts.MarkLineOpts( data=[ opts.MarkLineItem(type_="average", name="平均值")]))bar.render('年龄分布.html')
31 岁的相亲男女人数最多,有 2637 人,各个年龄段都有一定数量的人,我们将年龄小于等于 20 岁,大于等于 70 岁的相亲男女数据单独提取出来看看。import pandas as pd
df = pd.read_excel('处理后数据.xlsx')df1 = df[df['年龄'] <= 20]df2 = df1['婚况'].value_counts() print(df2)
结果如下:未婚 153离异 6丧偶 2Name: 婚况, dtype: int64
大部分是未婚,年纪轻轻就那么急着相亲吗?再看看婚况是离异、丧偶的数据,import pandas as pd
df = pd.read_excel('处理后数据.xlsx')df1 = df[df['年龄'] <= 20]
df3 = df1[df1['婚况'] == '离异']print(df3)
                网名  性别  ...  学历     月薪17425          微风轻起  男士  ...  未知  5000029645            媳妇  女士  ...  大专     未知30398            仙妹  女士  ...  高中     未知30485  会员1415395937  男士  ...  未知  3500036684         微笑着变老  女士  ...  高中     未知49864        风吹动了风玲  女士  ...  高中     未知
[6 rows x 9 columns]
月薪写着 50000、35000 的男士有些显眼啊,取数据集中查看。
月薪 50000 的微风轻起,征婚信息年龄写的 19,征婚宣言里又写到 1994 年 26 岁;月薪 35000 的会员某某某,征婚信息年龄写的 20,征婚宣言里又写到 81 年的,看来网站里年龄、身高这些信息真实性值得怀疑。"""@File :男女占比情况.py@Author :叶庭云@CSDN :https://yetingyun.blog.csdn.net/"""import pandas as pdimport collectionsfrom pyecharts.charts import Piefrom pyecharts import options as optsfrom pyecharts.globals import ThemeType, CurrentConfig
CurrentConfig.ONLINE_HOST = 'D:/python/pyecharts-assets-master/assets/'df = pd.read_excel('处理后数据.xlsx')data = df[df['婚况'] != '未填写']data_count = collections.Counter(data['婚况']).most_common()print(data)
c = ( Pie() .add( "婚况", data_count, radius=["40%", "55%"], label_opts=opts.LabelOpts( position="outside", formatter="{a|{a}}{abg|}\n{hr|}\n {b|{b}: }{c} {per|{d}%} ", background_color="#eee", border_color="#aaa", border_width=1, border_radius=4, rich={ "a": {"color": "#999", "lineHeight": 22, "align": "center"}, "abg": { "backgroundColor": "#e3e3e3", "width": "100%", "align": "right", "height": 22, "borderRadius": [4, 4, 0, 0],
}, "hr": { "borderColor": "#aaa", "width": "100%", "borderWidth": 0.5, "height": 0, }, "b": {"fontSize": 16, "lineHeight": 33}, "per": { "color": "#eee", "backgroundColor": "#334455", "padding": [2, 4], "borderRadius": 2, }, }, ), ) .set_colors(["#8B008B", "#FF1493", "#000000"]) .set_global_opts(title_opts=opts.TitleOpts(title="相亲男女婚况")) .render("pie_rich_label.html"))
相亲男女婚况,离异的占比 57.67%,未婚占比 34.14%,丧偶占比 8.19%。"""@File :学历分布.py@Author :叶庭云@CSDN :https://yetingyun.blog.csdn.net/"""import pandas as pdimport collectionsfrom pyecharts.charts import Piefrom pyecharts import options as optsfrom pyecharts.globals import CurrentConfig
CurrentConfig.ONLINE_HOST = 'D:/python/pyecharts-assets-master/assets/'df = pd.read_excel('处理后数据.xlsx')data = df[df['学历'] != '未知']data_count = collections.Counter(data['学历']).most_common()c = ( Pie(init_opts=opts.InitOpts(width="800px", height="500px", bg_color="#2c343c")) .add( series_name="相亲男女学历", data_pair=data_count, rosetype="radius", radius="55%", center=["50%", "50%"], label_opts=opts.LabelOpts(is_show=False, position="center"), ) .set_colors(["#00BFFF", "#00FF7F", "#FF1493", "#8B008B", "#FFFF00", "#556B2F"]) .set_global_opts( title_opts=opts.TitleOpts( title="相亲男女学历", pos_left="center", pos_top="20", title_textstyle_opts=opts.TextStyleOpts(color="#fff"), ), legend_opts=opts.LegendOpts(is_show=False), ) .set_series_opts(
tooltip_opts=opts.TooltipOpts( trigger="item", formatter="{a}
{b}: {c} ({d}%)" ), label_opts=opts.LabelOpts(color="#fff"), ) .render("相亲男女学历.html"))
相亲男女学历大部分在高中(35.92%)、大专(24.72%),有近六成的相亲男女,本科占比 20.7%,中专占比 16.35%,硕士、博士高学历的相亲男女人数较少,分别占比 2.14%,0.17%。"""@File :地区分布.py@Author :叶庭云@CSDN :https://yetingyun.blog.csdn.net/"""import pandas as pdimport collectionsfrom pyecharts import options as optsfrom pyecharts.charts import Geofrom pyecharts.globals import ChartTypefrom pyecharts.globals import ThemeType, CurrentConfig
CurrentConfig.ONLINE_HOST = 'D:/python/pyecharts-assets-master/assets/'
df = pd.read_excel('处理后数据.xlsx')area = list(df['居住地'])area_count = collections.Counter(area).most_common(34)print(area_count)
geo = Geo(init_opts=opts.InitOpts(width='1000px', height='600px', theme=ThemeType.DARK))geo.add_schema(maptype='china', label_opts=opts.LabelOpts(is_show=True))geo.add('相亲男女人数', data_pair=area_count, type_=ChartType.EFFECT_SCATTER)geo.set_series_opts(label_opts=opts.LabelOpts(is_show=False)) geo.set_global_opts(title_opts=opts.TitleOpts(title="相亲男女地区分布"), visualmap_opts=opts.VisualMapOpts(max_=5000, is_piecewise=True, pieces=[{"max": 1000, "min": 100, "label": "100-1000", "color": "#708090"}, {"max": 1500, "min": 1001, "label": "1001-1500", "color": "#00008B"}, {"max": 2000, "min": 1501, "label": "1501-2000", "color": "#483D8B"}, {"max": 2500, "min": 2001, "label": "2001-2500", "color": "#1E90FF"}, {"max": 3000, "min": 2501, "label": "2501-3000", "color": "#8B008B"}, {"max": 5000, "min": 3001, "label": ">=3000", "color": "#FF0000"}]) )geo.render('地区分布.html')
[('重庆', 4436), ('广东', 2637), ('四川', 2519
), ('山东', 2398), ('河南', 2160), ('上海', 2156), ('云南', 2039), ('北京', 2037), ('台湾', 1997), ('安徽', 1920), ('江苏', 1919), ('天津', 1918), ('黑龙江', 1918), ('湖南', 1800), ('新疆', 1799), ('辽宁', 1680), ('甘肃', 1680), ('广西', 1679), ('湖北', 1679), ('内蒙古', 1559), ('山西', 1440), ('福建', 1440), ('江西', 1440), ('浙江', 1440), ('陕西', 1439), ('河北', 1439), ('青海', 1339), ('贵州', 1200), ('吉林', 1080), ('西藏', 942), ('宁夏', 702), ('海南', 360), ('香港', 353), ('澳门', 117)]

征婚宣言一般是介绍自己情况,表达对另一半的要求和期望,下面我们分别来看看相亲男女征婚宣言里关键词都有些什么。"""@File :征婚宣言词云.py@Author :叶庭云@CSDN :https://yetingyun.blog.csdn.net/"""import pandas as pdimport jiebaimport collectionsimport refrom wordcloud import WordCloudimport matplotlib.pyplot as pltimport numpy as npfrom PIL import Image
df = pd.read_excel('处理后数据.xlsx')[['性别', '征婚宣言']]df2 = df[df['性别'] == '女士']['征婚宣言']
with open('stop_words.txt', encoding='utf-8') as f: con = f.read().split('\n') stop_words = set() for i in con: stop_words.add(i)
result_list = []for data in df2: new_data = re.findall('[\u4e00-\u9fa5]+', data, re.S) new_data = "/".join(new_data) seg_list_exact = jieba.cut(new_data, cut_all=True) for word in seg_list_exact: if word not in stop_words and len(word) > 1: result_list.append(word)
print(result_list)word_counts = collections.Counter(result_list)mask_ = 255 - np.array(Image.open('woman_mask.png'))my_cloud = WordCloud( background_color='white', mask=mask_, font_path='simhei.ttf', max_font_size=112, min_font_size=12, random_state=88 ).generate_from_frequencies(word_counts)
plt.figure(figsize=(8, 5), dpi=200)
plt.imshow(my_cloud, interpolation='bilinear')plt.axis('off')plt.savefig('woman_cloud.png', dpi=200)plt.show()
结果如下:
 相亲男女征婚宣言里,喜欢、希望、生活、善良、真诚、真心、幸福、性格都是出现频率高的词语。
程序员如何避免陷入“内卷”、选择什么技术最有前景,中国开发者现状与技术趋势究竟是什么样?快来参与「2020 中国开发者大调查」,更有丰富奖品送不停!


☞估值飙至 280 亿美元,Databricks G 轮融资 10 亿美元,谁说开源不挣钱?
☞编程网站 Perl.com 被劫,售价 19 万美元