点击上方“小白学视觉”,选择加"星标"或“置顶”
重磅干货,第一时间送达

大家知道,考研很大一部分也是考信息收集能力。每年往往有很多人就是在这上面栽跟头了,不能正确分析各大院校往年的录取信息,进而没能选择合适的报考院校。
至于很多院校的录取信息是以 PDF 形式发布,例如我手上的深大电通录取结果,这就需要我们先把 PDF 转化为 Excel 啦。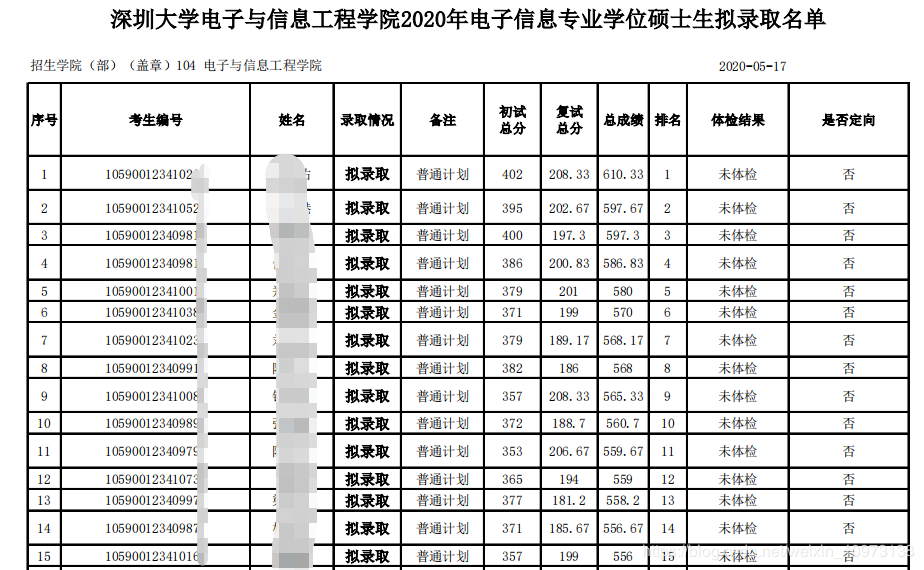 (1)PDF
 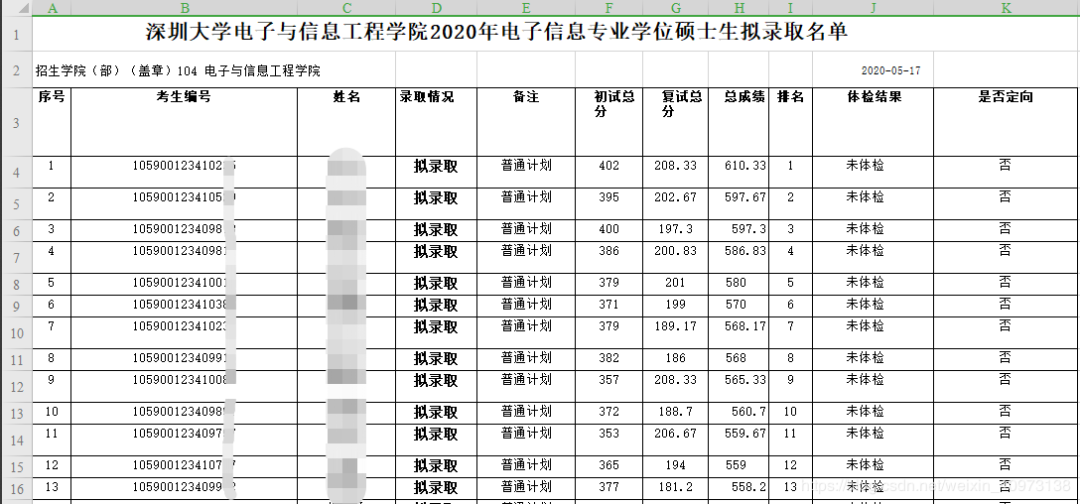 (2)Excel
#coding=utf8
import xlrd
import numpy as np
from pyecharts.charts import Bar
from pyecharts.charts import Pie, Grid
from pyecharts import options as opts
#==================== 准备数据 ====================
# 导入Excel 文件
data = xlrd.open_workbook("C:/深圳大学电子与信息工程学院2020年电子信息硕士生拟录取名单.xlsx")
# 载入第一个表格
table = data.sheets()[0]
tables = []

def Read_Excel(excel):
    # 从第4行开始读取数据,因为这个Excel文件里面从第四行开始才是考生信息
    for rows in range(3, excel.nrows-1):
        dict_ = {"id":"", "name":"", "status":"", "preliminary_score":"", "retest_score":"", "total_score":"", "ranking":""}
        dict_["id"] = table.cell_value(rows, 1)
        dict_["name"] = table.cell_value(rows, 2)
        dict_["status"] = table.cell_value(rows, 3)
        dict_["remarks"] = table.cell_value(rows, 4)
        dict_["preliminary_score"] = table.cell_value(rows, 5)
        dict_["retest_score"] = table.cell_value(rows, 6)
        dict_["total_score"] = table.cell_value(rows, 7)
        dict_["ranking"] = table.cell_value(rows, 8)
        # 将未被录取或者非普通计划录取的考生滤除
        if dict_["status"] == str("拟录取") and dict_["remarks"] == str("普通计划"):
            tables.append(dict_)
# 执行上面方法
Read_Excel(table)
for
i in tables:
print(i)
这步因人而异,我只是想把各个分数段进行单独统计而已,大家也可以根据自己的喜好做其它的处理。num_score_300_310 = 0
num_score_310_320 = 0
num_score_320_330 = 0
num_score_330_340 = 0
num_score_340_350 = 0
num_score_350_360 = 0
num_score_360_370 = 0
num_score_370_380 = 0
num_score_380_390 = 0
num_score_390_400 = 0
num_score_400_410 = 0
min_score = 999
max_score = 0
# 将各个分段的数量统计
for i in tables:
score = i["preliminary_score"]
if score > max_score:
max_score = score
if score min_score = score
if score in range(300, 310):
num_score_300_310 = num_score_300_310 + 1
elif score in range(310, 320):
num_score_310_320 = num_score_310_320 + 1
elif score in range(320, 330):
num_score_320_330 = num_score_320_330 + 1
elif score in range(330, 340):
num_score_330_340 = num_score_330_340 + 1
elif score in range(340, 350):
num_score_340_350 = num_score_340_350 + 1
elif score in range(350, 360):
num_score_350_360 = num_score_350_360 + 1
elif score in range(360, 370):
num_score_360_370 = num_score_360_370 + 1
elif score in range(370, 380):
num_score_370_380 = num_score_370_380 + 1
elif score in range(380, 390):
num_score_380_390 = num_score_380_390 + 1
elif score in range(390, 400):
num_score_390_400 = num_score_390_400 + 1
elif score in range(400, 410):
num_score_400_410 = num_score_400_410 + 1
# 构建两个元组用以后期建表方便
bar_x_axis_data = ("300-310", "310-320", "320-330", "330-340", "340-350", "350-360", "360-370", "370-380", "380-390", "390-400", "400-410")
bar_y_axis_data = (num_score_300_310, num_score_310_320, num_score_320_330,\
num_score_330_340, num_score_340_350, num_score_350_360,\
num_score_360_370, num_score_370_380, num_score_380_390,\
num_score_390_400, num_score_400_410)
#===================== 柱状图 =====================
# 构建柱状图
c = (
    Bar()
    .add_xaxis(bar_x_axis_data)
    .add_yaxis("录取考生", bar_y_axis_data, color="#af00ff")
    .set_global_opts(title_opts=opts.TitleOpts(title="数量"))
    .render("C:/录取数据图.html")
)
#====================== 饼图 ======================
c = (
Pie(init_opts=opts.InitOpts(height="800px"
, width="1200px"))
.add("录取分数概览",
[list(z) for z in zip(bar_x_axis_data, bar_y_axis_data)],
center=["35%", "38%"],
radius="40%",
label_opts=opts.LabelOpts(
formatter="{b|{b}: }{c} {per|{d}%} ",
rich={
"b": {"fontSize": 16, "lineHeight": 33},
"per": {
"color": "#eee",
"backgroundColor": "#334455",
"padding": [2, 4],
"borderRadius": 2,
},
}
))
.set_global_opts(title_opts=opts.TitleOpts(title="录取", subtitle='Made by 王昊'),
legend_opts=opts.LegendOpts(pos_left="0%", pos_top="65%"))
.render("C:/录取饼图.html")
)
下载1:OpenCV-Contrib扩展模块中文版教程
在「小白学视觉」公众号后台回复:扩展模块中文教程,即可下载全网第一份OpenCV扩展模块教程中文版,涵盖扩展模块安装、SFM算法、立体视觉、目标跟踪、生物视觉、超分辨率处理等二十多章内容。在「小白学视觉」公众号后台回复:Python视觉实战项目,即可下载包括图像分割、口罩检测、车道线检测、车辆计数、添加眼线、车牌识别、字符识别、情绪检测、文本内容提取、面部识别等31个视觉实战项目,助力快速学校计算机视觉。在「小白学视觉」公众号后台回复:OpenCV实战项目20讲,即可下载含有20个基于OpenCV实现20个实战项目,实现OpenCV学习进阶。交流群
欢迎加入公众号读者群一起和同行交流,目前有SLAM、三维视觉
、传感器、自动驾驶、计算摄影、检测、分割、识别、医学影像、GAN、算法竞赛等微信群(以后会逐渐细分),请扫描下面微信号加群,备注:”昵称+学校/公司+研究方向“,例如:”张三 + 上海交大 + 视觉SLAM“。请按照格式备注,否则不予通过。添加成功后会根据研究方向邀请进入相关微信群。请勿在群内发送广告,否则会请出群,谢谢理解~