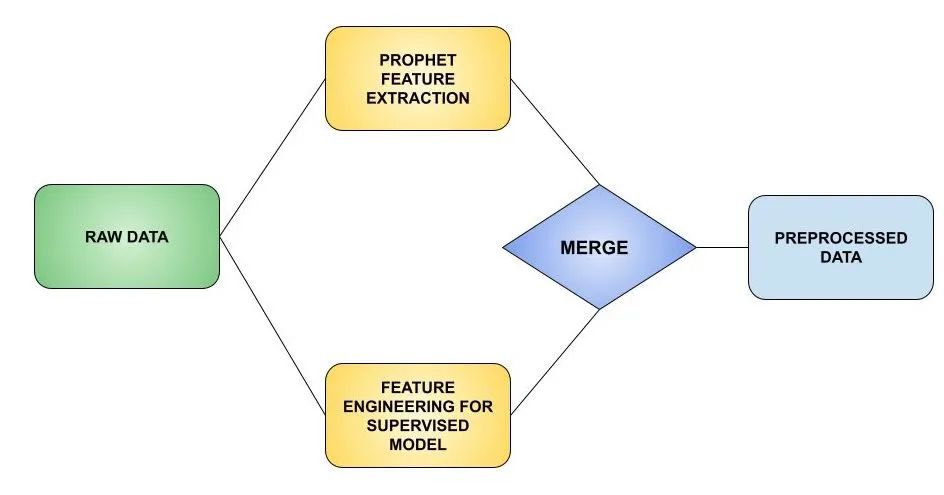
一般情况下 LightGBM 模型都会使用一些lag的特征来预测未来的结果,这样做一般情况下能够取得很好的效果。本文介绍一种新的思路:使用 Prophet 从时间序列中提取新特征,然后使用LightGBM 进行训练,可以得到更好的效果。Prophet 模型的实际预测、置信区间的上限和下限、每日和每周的季节性和趋势等都可以作为我们的新特征。对于其他类型的问题,Prophet 还可以帮助我们提取描述假日效果。
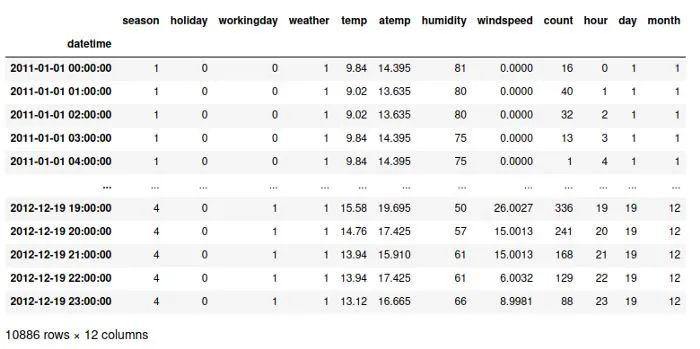
原始数据
我们的数据如下所示:
使用 Prophet 提取特征
我们特征工程的第一步非常简单。我们只需要使用Prophet 模型进行预测:
def prophet_features(df, horizon=24*7):
temp_df = df.reset_index()
temp_df = temp_df[['datetime', 'count']]
temp_df.rename(columns={'datetime': 'ds', 'count': 'y'}, inplace=True)
# 以上周的数据集为例进行验证
train, test = temp_df.iloc[:-horizon,:], temp_df.iloc[-horizon:,:]
# 定义 prophet model
m = Prophet(
growth='linear',
seasonality_mode='additive',
interval_width=0.95,
daily_seasonality=True,
weekly_seasonality=True,
yearly_seasonality=False
)
# 训练 prophet model
m.fit(train)
# 从数据中提取特征,利用prophet预测训练集
predictions_train = m.predict(train.drop('y', axis=1))
# 使用prophet从数据中提取特征来预测测试集
predictions_test = m.predict(test.drop('y', axis=1))
# 合并训练和测试的预测集合
predictions = pd.concat([predictions_train, predictions_test], axis=0)
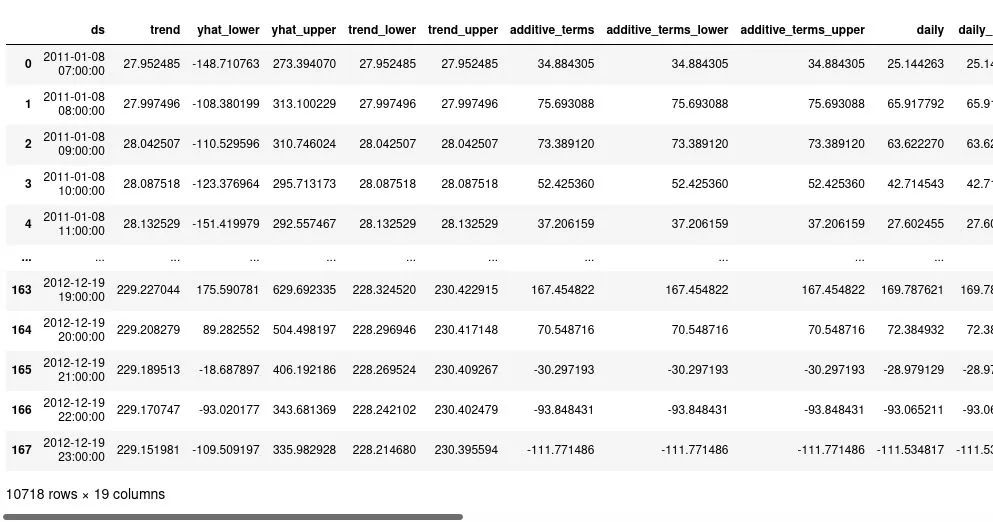
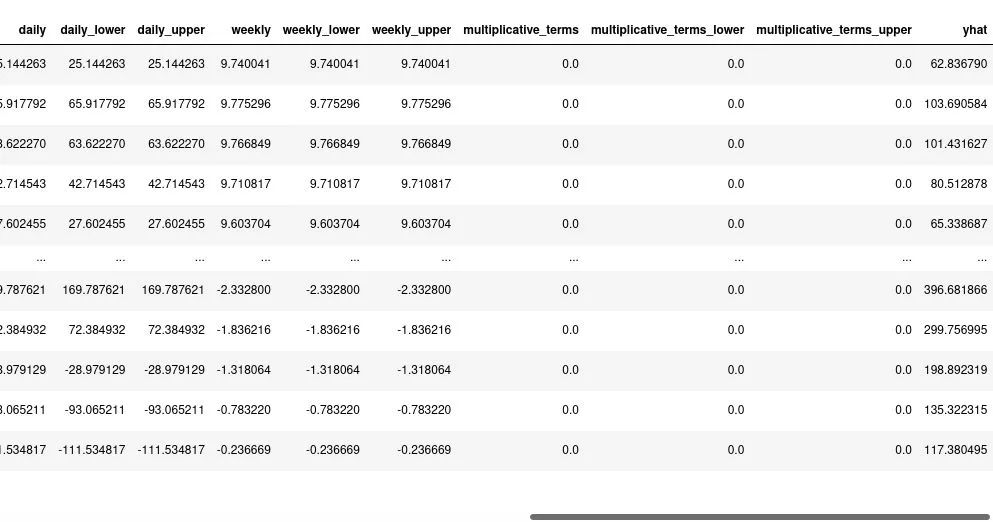
return predictions
上面的函数将返回一个给我们的 LightGBM 模型准备的新特征的DF:
使用 Prophet 特征训练 Autorregressive LightGBM
我们使用 Prophet 提取了新特征,下一步就是进行特征的合并和使用 LightGBM 进行预测:
def train_time_series_with_folds_autoreg_prophet_features(df, horizon=24*7, lags=[1, 2, 3, 4, 5]):
# 创建一个包含所有用Prophet创建的新特性的数据框架
new_prophet_features = prophet_features(df, horizon=horizon)
df.reset_index(inplace=True)
# 合并Prophet的特性数据帧与我们的第一个数据帧
df = pd.merge(df, new_prophet_features, left_on=['datetime'], right_on=['ds'], how='inner')
df.drop('ds', axis=1, inplace=True)
df.set_index('datetime', inplace=True)
# 使用Prophet预测创建一些滞后变量(yhat列)
for lag in lags:
df[f'yhat_lag_{lag}'] = df['yhat'].shift(lag)
df.dropna(axis=0, how='any')
X = df.drop('count', axis=1)
y = df['count']
# 以上周的数据集为例进行验证
X_train, X_test = X.iloc[:-horizon,:], X.iloc[-horizon:,:]
y_train, y_test = y.iloc[:-horizon], y.iloc[-horizon:]
# 定义LightGBM模型,训练并进行预测
model = LGBMRegressor(random_state=42)
model.fit(X_train, y_train)
predictions = model.predict(X_test)
# 计算 MAE
mae = np.round(mean_absolute_error(y_test, predictions), 3)
# 对数据集最后一周的现实和预测进行情节分析
fig = plt.figure(figsize=(16,6))
plt.title(f'Real vs Prediction - MAE {mae}', fontsize=20)
plt.plot(y_test, color='red')
plt.plot(pd.Series(predictions, index=y_test.index), color='green')
plt.xlabel('Hour', fontsize=16)
plt.ylabel('Number of Shared Bikes', fontsize=16)
plt.legend(labels=['Real', 'Prediction'], fontsize=16)
plt.grid()
plt.show()
执行上述代码后,我们将合并特征df,创建滞后的lag值,训练 LightGBM 模型,然后用我们训练的模型进行预测,将我们的预测与实际结果进行比较。输出将如下所示:
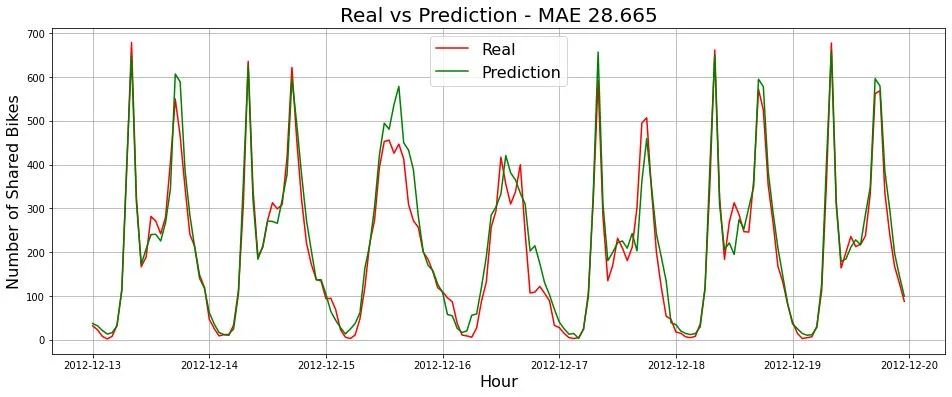
如果我们仔细观察结果我们的 MAE 为 28.665。这要比一般特征工程结果有很大的提高。
将监督机器学习方法与 Prophet 等统计方法相结合,可以帮助我们取得令人印象深刻的结果。根据我在现实世界项目中的经验,很难在需求预测问题中获得比这些更好的结果。


