作者 | lqj_本人
编辑 | 自动驾驶技术网
原文链接:http://t.csdn.cn/WSOc7
前言
本程序主要讲述python的AI视觉方面的应用:自动驾驶寻找车道。
项目前须知
1.opencv的图像灰度转化方法
gray = cv2.cvtColor("图像", cv2.COLOR_RGB2GRAY)
2.opencv检测图像边缘
高斯模糊图像
cv2.GaussianBlur(gray, (5, 5), 0)
获取精明图像
canny = cv2.Canny(blur, 50, 150)
3.matplotlib绘制图像库的使用
项目详情
我们先拿到实时摄像的某一帧的图像
导入库
import cv2import numpy as npimport matplotlib.pyplot as plt
边缘检测
进行图像的灰度转化以及图像的边缘检测
def canny(image): """1.图像的灰度转化""" #把某一帧的图片转换成灰度图像 gray = cv2.cvtColor(lane_image, cv2.COLOR_RGB2GRAY) """2.检测图像边缘""" #高斯模糊图像 blur = cv2.GaussianBlur(gray, (5, 5), 0) #获取精明的图片 canny = cv2.Canny(blur, 50, 150) return cannyimage = cv2.imread('1.jpg')lane_image = np.copy(image)canny = canny(lane_image)plt.imshow(canny)plt.show()
得到绘图结果
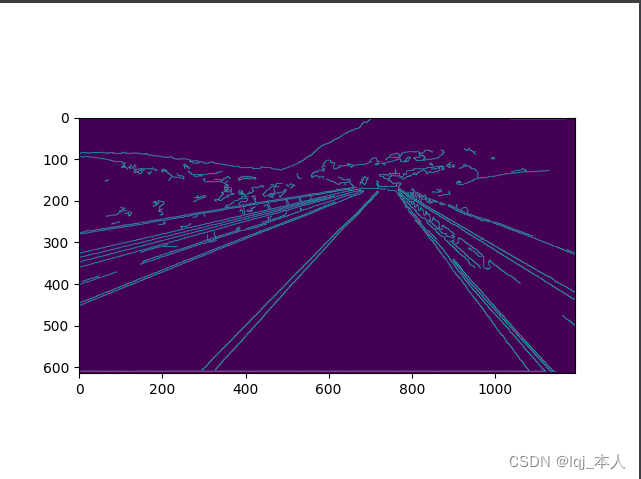
因为中国的车道时沿右边行驶的,所以我们可以在绘图的图像中清楚的看见X轴与Y轴的数码,由X轴的(400,0)位置到X轴的大约(1100,0)位置是右车道的宽度,然后我们再来看Y轴的数码,大约在150的位置是我们可视范围内的右车道的尽头点,又因为(400,0)到(1100,0)的距离为700px,所以我们可以得到可视范围内的右车道的尽头点为(700,150)。
根据上述位置的计算,我们可以得出一个右车道中的三角形
def region_of_interest(image): height = image.shape[0]
polygons = np.array([ [(400,height),(1100,height),(700,150)] ]) mask = np.zeros_like(image) cv2.fillPoly(mask,polygons,255) return mask
image = cv2.imread('1.jpg')lane_image = np.copy(image)canny = canny(lane_image)cv2.imshow('result',region_of_interest(canny))cv2.waitKey(0)
得出检测三角形
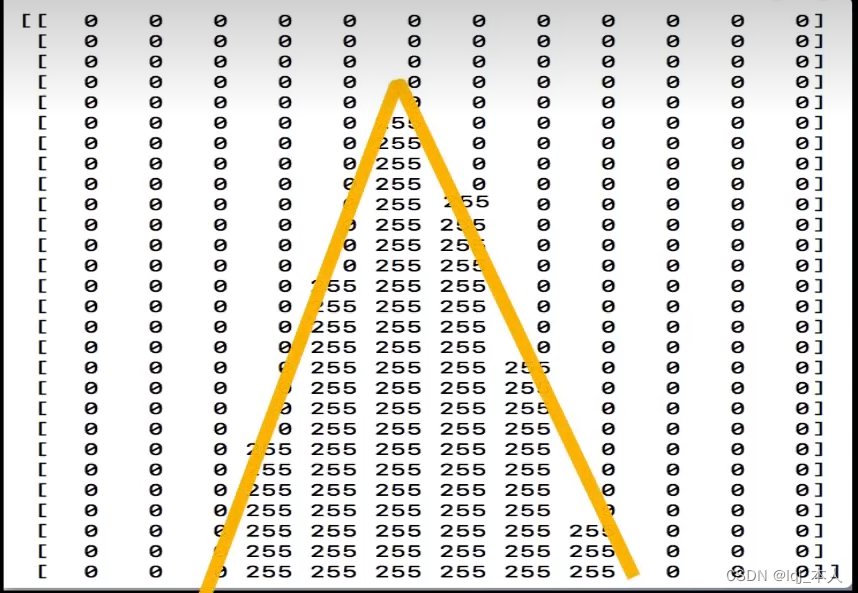
生成蒙版
将检测到的图像由255(白色)表示,周围区域用0(黑色表示)
有时候三角形不是正好与我们看到的进到点到左右两侧点的形状正好相似,所以我们需要自己微调一下
polygons = np.array([ [(400,height),(1200,height),(800,200)] ])
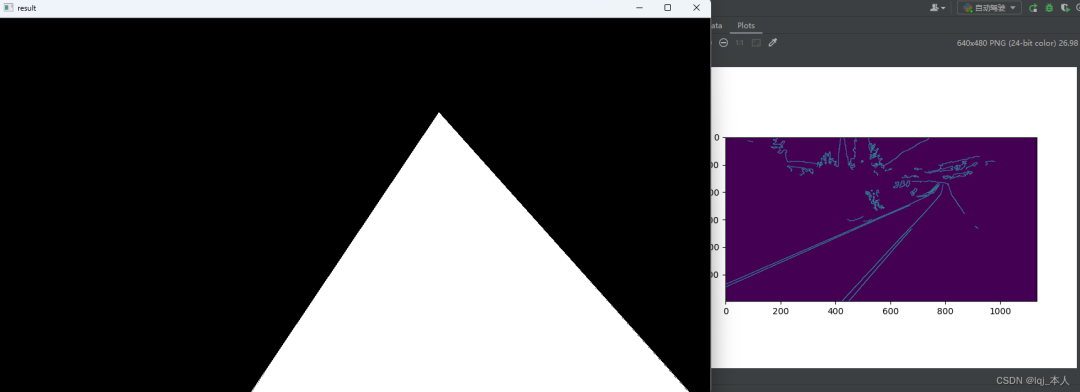
然后,我们可以对我们的图像进行右车道三角形的裁剪
masked_image = cv2.bitwise_and(image,mask)
cropped_image = region_of_interest(canny)cv2.imshow('result',cropped_image)
边缘检测与蒙版产生的效果
裁剪显示图像
定义车道起始点位置
def make_coordinates(image,line_parameters): slope,intercept = line_parameters print(image.shape) y1 = image.shape[0] y2 = int(y1*(3/5)) x1 = int((y1 - intercept)/slope) x2 = int((y2 - intercept)/slope) return np.array([x1,y1,x2,y2])
霍夫变换的直线检测
用到的是Opencv封装好的函数cv.HoughLinesP函数,使用到的参数如下:
image:输入图像,通常为canny边缘检测处理后的图像
rho:线段以像素为单位的距离精度
theta:像素以弧度为单位的角度精度(np.pi/180较为合适)
threshold:霍夫平面累加的阈值
minLineLength:线段最小长度(像素级)
maxLineGap:最大允许断裂长度
lines = cv2.HoughLinesP(cropped_image, 2, np.pi/180, 100, np.array([]), minLineLength=40, maxLineGap=5)
绘制车道
def display_lines(image,lines): line_image = np.zeros_like(image) if lines is not None: for line in lines: # print(line) x1,y1,x2,y2 = line.reshape(4) cv2.line(line_image,(x1,y1),(x2,y2),(255,100,10),10) return line_image
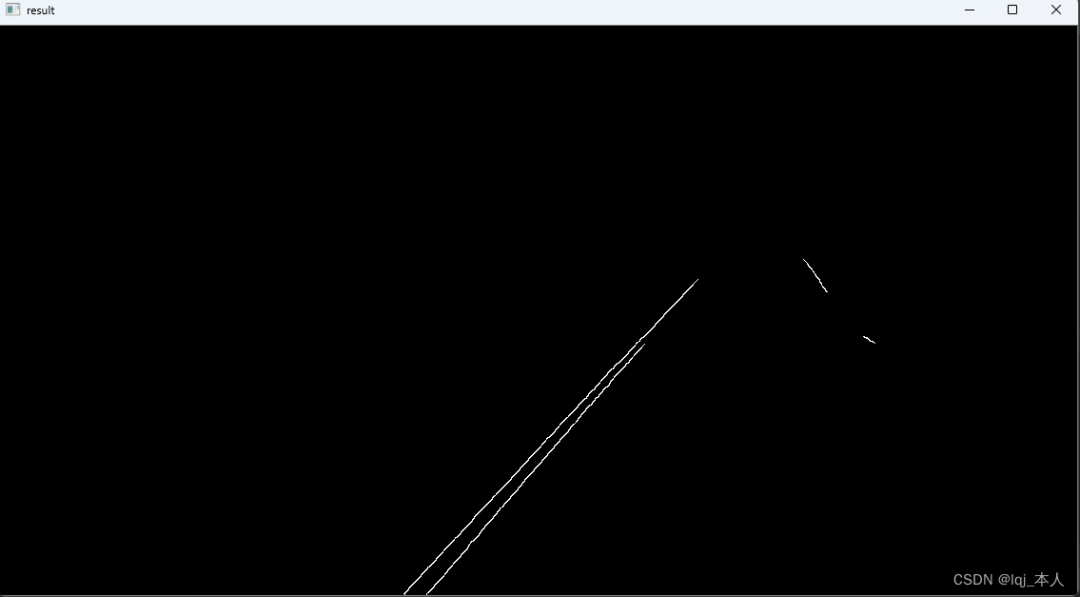
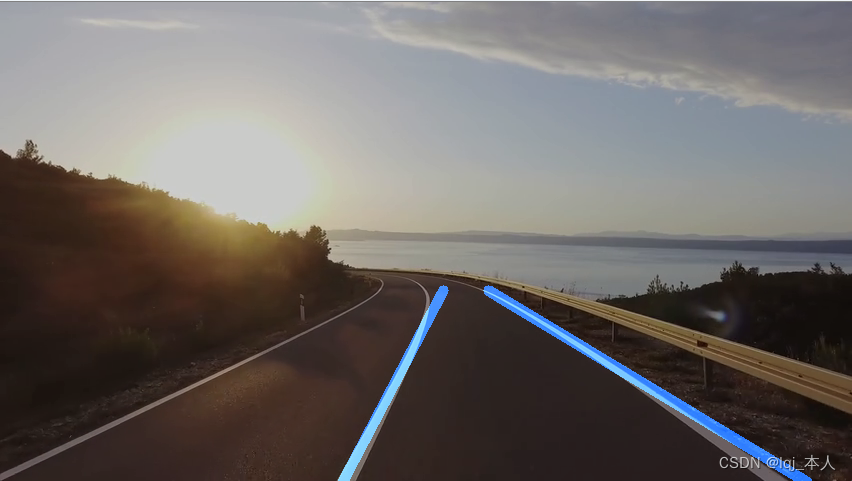
效果图像

图像与绘制车道融合
视频流中位置检测
def average_slope_intercept(image,lines): left_fit = [] right_fit = [] if lines is None: return None for line in lines: x1,y1,x2,y2 = line.reshape(4) parameters = np.polyfit((x1,x2),(y1,y2),1) # print(parameters) slope = parameters[0] intercept = parameters[1] if slope < 0: left_fit.append((slope,intercept)) else: right_fit.append((slope,intercept)) print(left_fit) print(right_fit)
打印左右位置结果
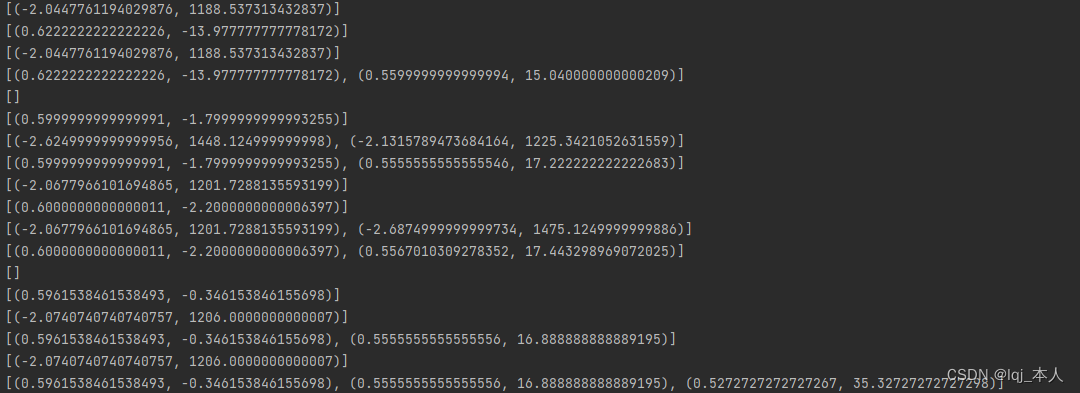
检测数每一帧的左右位置结果
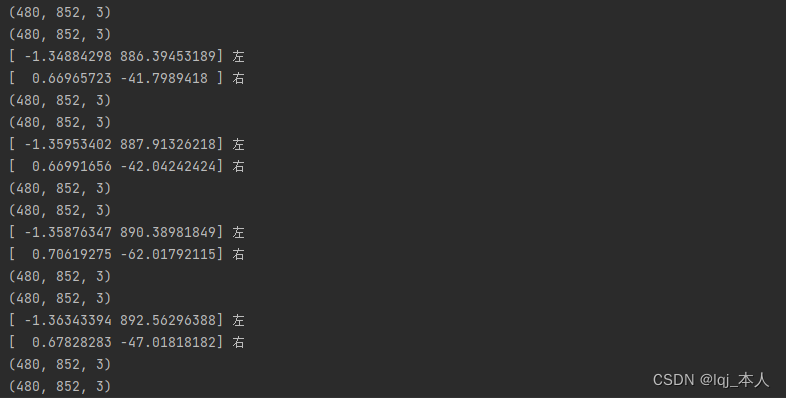
left_fit_average = np.average(left_fit,axis=0) right_fit_average = np.average(right_fit,axis=0) print(left_fit_average,'左') print(right_fit_average,'右') left_line = make_coordinates(image,left_fit_average) right_line = make_coordinates(image,right_fit_average) return np.array([left_line,right_line])
导入视频流做最后处理
cap = cv2.VideoCapture('3.mp4')
# try:while cap.isOpened():        _,frame = cap.read()
        canny_image = canny(frame)
        cropped_image = region_of_interest(canny_image)
        lines = cv2.HoughLinesP(cropped_image, 2, np.pi/180, 100, np.array([]), minLineLength=40, maxLineGap=5)
        averaged_lines = average_slope_intercept(frame, lines)
        line_image = display_lines(frame, averaged_lines)
        combo_image = cv2.addWeighted(frame, 0.8, line_image, 1, 1)
        # cv2.resizeWindow("result", 1080, 960);
        cv2.imshow('result', line_image)
        cv2.waitKey(10)
完整代码
import cv2import numpy as npimport matplotlib.pyplot as plt
def make_coordinates(image,line_parameters): slope,intercept = line_parameters print(image.shape) y1 = image.shape[0] y2 = int(y1*(3/5)) x1 = int((y1 - intercept)/slope) x2 = int((y2 - intercept)/slope) return np.array([x1,y1,x2,y2])
def average_slope_intercept(image,lines): left_fit = [] right_fit = [] if lines is None: return None for line in lines: x1,y1,x2,y2 = line.reshape(4) parameters = np.polyfit((x1,x2),(y1,y2),1) # print(parameters) slope = parameters[0] intercept = parameters[1] if slope < 0: left_fit.append((slope,intercept)) else: right_fit.append((slope,intercept)) # print(left_fit) # print(right_fit) left_fit_average = np.average(left_fit,axis=0) right_fit_average = np.average(right_fit,axis=0) print(left_fit_average,'左')
print(right_fit_average,'右') left_line = make_coordinates(image,left_fit_average) right_line = make_coordinates(image,right_fit_average) return np.array([left_line,right_line])
def canny(image): """1.图像的灰度转化""" #把某一帧的图片转换成灰度图像 gray = cv2.cvtColor(image, cv2.COLOR_RGB2GRAY) """2.检测图像边缘""" #高斯模糊图像 blur = cv2.GaussianBlur(gray, (5, 5), 0) #获取精明的图片 canny = cv2.Canny(blur, 50, 150) return canny#每一行都是一个二维数组,包含我们的线坐标,形式为[[x1,yl,x2,y2]]。这些坐标指定了线条的参数,以及线条相对与图像空间位置,确保他们被放置在正确的位置def display_lines(image,lines): line_image = np.zeros_like(image) if lines is not None: for line in lines: # print(line) x1,y1,x2,y2 = line.reshape(4) cv2.line(line_image,(x1,y1),(x2,y2),(255,100,10),10) return line_image
def region_of_interest(image): height = image.shape[0] polygons = np.array([ [(300,height),(650,height),(500,150)] ]) mask = np.zeros_like(image) cv2.fillPoly(mask,polygons,255) masked_image = cv2.bitwise_and(image,mask) return masked_image
# image = cv2.imread('1.png')# lane_image = np.copy(image)# canny_image = canny(lane_image)# cropped_image = region_of_interest(canny_image)# lines = cv2.HoughLinesP(cropped_image,2,np.pi/180,100,np.array([]),minLineLength=40,maxLineGap=5)# averaged_lines = average_slope_intercept(lane_image,lines)# line_image = display_lines(lane_image,averaged_lines)# combo_image = cv2.addWeighted(lane_image,0.8,line_image,1,1)# cv2.imshow('result',combo_image)# cv2.waitKey(0)
cap = cv2.VideoCapture('3.mp4')
# try:while cap.isOpened(): _,frame = cap.read()
canny_image = canny(frame)
cropped_image = region_of_interest(canny_image)
lines = cv2.HoughLinesP(cropped_image, 2, np.pi/180, 100, np.array([]), minLineLength=40, maxLineGap=5)
averaged_lines = average_slope_intercept(frame, lines)
line_image = display_lines(frame, averaged_lines)
combo_image = cv2.addWeighted(frame, 0.8, line_image, 1, 1)
# cv2.resizeWindow("result", 1080, 960);
cv2.imshow('result', combo_image)
cv2.waitKey(10)
用前须知
根据自己的需要适当微调参数:
def region_of_interest(image): height = image.shape[0] polygons = np.array([ [(300,height),(650,height),(500,150)] ]) mask = np.zeros_like(image) cv2.fillPoly(mask,polygons,255) masked_image = cv2.bitwise_and(image,mask) return masked_image
效果显示