
译者 | 婉清
编辑 | 姗姗
出品 | 人工智能头条
【导读】今天为大家介绍机器学习、深度学习中一些优秀、有意思的 Python 库,以及这些库的 Code 实践教程。涉及到的理论与学术内容会附上相应的论文与博客,方便大家参考学习。
这个优秀的开源代码使用图卷积(graph convolution)来处理输入的图形,通过预测对象的边界框和分割掩码来计算场景布局,并将布局转换为具有级联细化网络(cascaded refinement network)的图像。
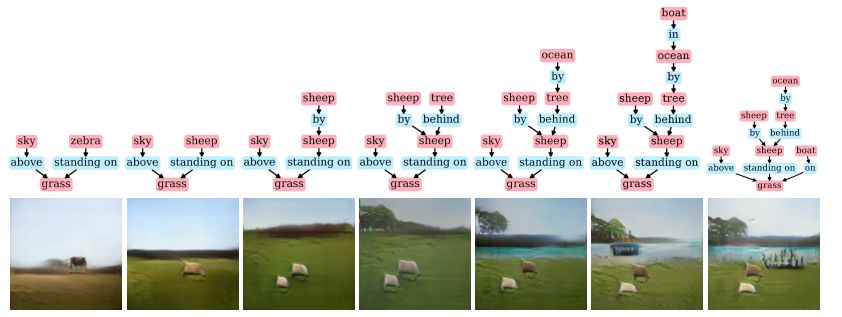
代码实现了一个端到端神经网络模型,输入的是场景图而输出的是图像。场景图是一个视景(visual scene)的结构化表示,其中节点表示场景中的对象,边缘表示对象之间的关系。
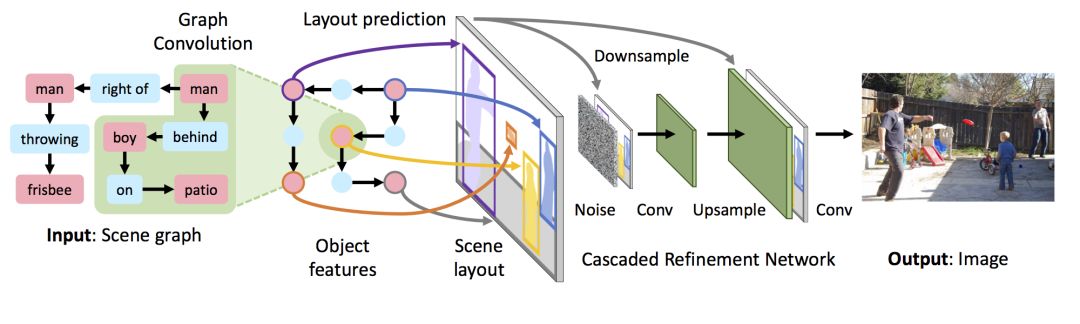
使用图卷积网络(graph convolution network)处理输入场景图,图卷积网络沿着边缘传递信息,计算所有对象的嵌入向量。这些向量被用于预测所有对象的边界框和分割掩码,他们结合起来形成一个粗略的场景布局。布局被传递到级联细化网络,该网络在增加的空间尺度上生成输出图像。这个模型针对一对鉴别器网络(discriminator networks)进行对抗训练,以确保输出图像看起来较为真实。
论文地址:
https://arxiv.org/abs/1804.01622
GitHub 地址:
https://github.com/google/sg2im
关于级联细化论文可参阅:
Photographic Image Synthesis with Cascaded Refinement Networks
https://arxiv.org/abs/1707.09405
▌如何运行和测试代码?
首先复制下面这段代码:
git clone https://github.com/google/sg2im.git
原始代码是在 Ubuntu 16.04 上使用 Python 3.5 和 PyTorch 0.4 进行开发和测试的。不过在虚拟环境中建议尝试一下通过设置虚拟环境来运行,可以参考下面的代码:
python3 -m venv env
source env/bin/activate
pip install -r requirements.txt
echo $PWD > env/lib/python3.5/site-packages/sg2im.pth
deactivate
注意:需要安装python-venv。下面的代码大家可以参考一下。
python3 -m venv --without-pip env
source env/bin/activate
pip install -r requirements.txt
echo $PWD > env/lib/python3.6/site-packages/sg2im.pth
deactivate
还需要从 requirements.txt 这个文件中中删除 pkg-resources=0.0.0,否则会出现 bug。至于为什么要删除pkg-resources==0.0.0可以参考链接中的内容介绍。
参考链接:
https://stackoverflow.com/questions/39577984/what-is-pkg-resources-0-0-0-in-output-of-pip-freeze-command/39638060。
接下来要运行预训练的模型。
先运行脚本 bash scripts/download_models.sh ,下载模型后再开始,这个过程大约需要 355 MB 的硬盘空间。
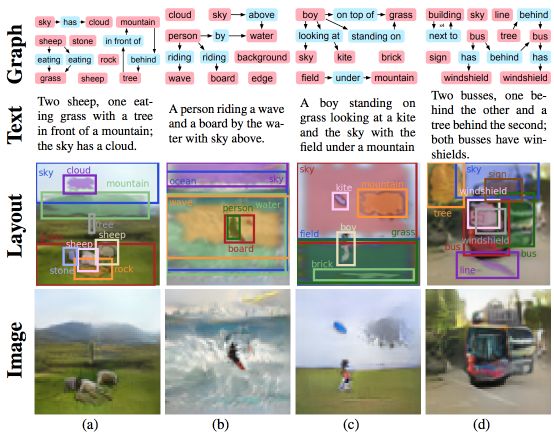
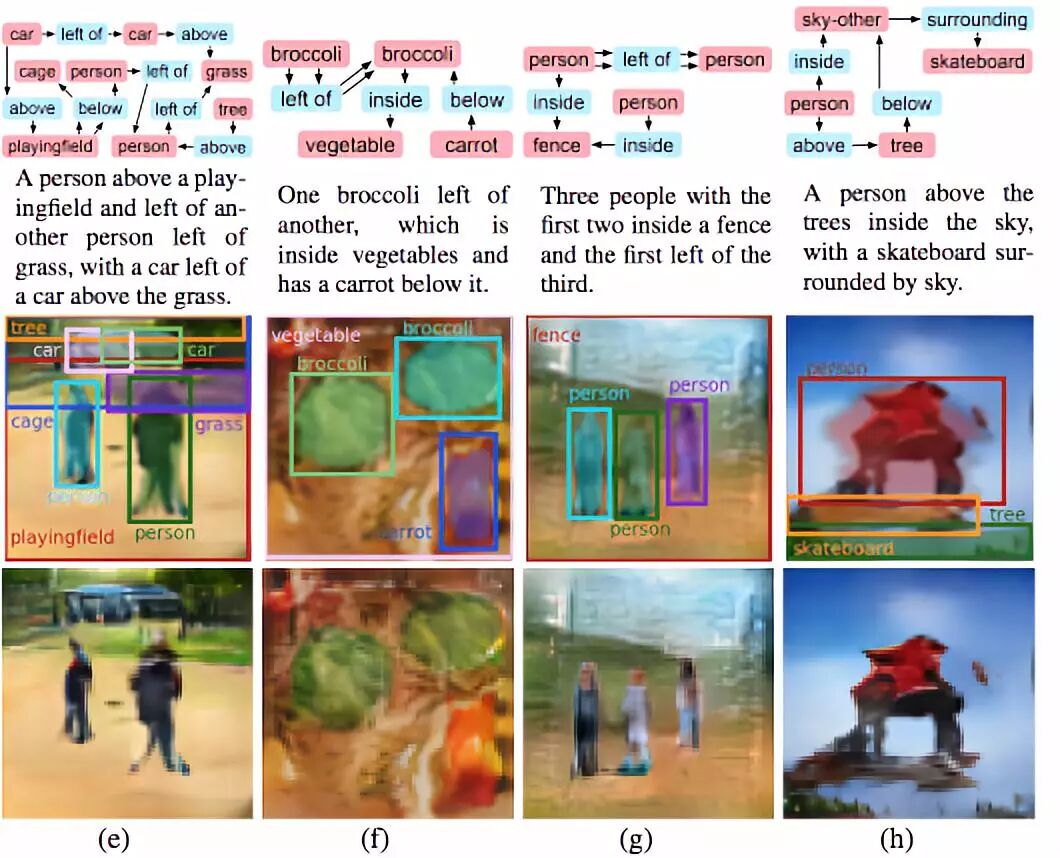
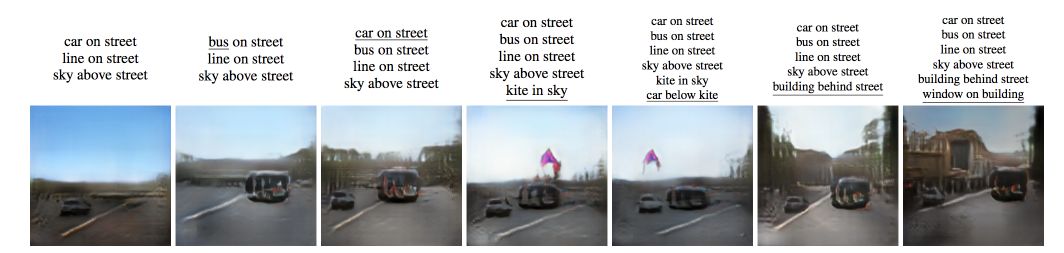
参考论文:
Image Generation from Scene Graphs
https://arxiv.org/pdf/1804.01622.pdf
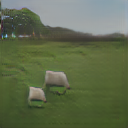
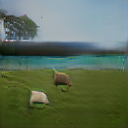
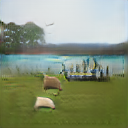
可以使用简单可读的 JSON 格式,运行脚本 scripts/run_model.py,在新场景图上可以轻松运行任何预训练模型。如果要重新创建上面的绵羊图像,需要运行下面这行代码:
python scripts/run_model.py \
下面是得到的图像结果

接下来我们一起看一下这段代码:
[
{
    "objects": ["sky", "grass", "zebra"],
    "relationships": [
      [0, "above", 1],
      [2, "standing on", 1]
    ]
},
{
"objects": ["sky", "grass", "sheep"],
"relationships": [
[0, "above", 1],
[2, "standing on", 1]
]
},
{
"objects": ["sky", "grass", "sheep", "sheep"],
"relationships": [
[0, "above", 1],
[2, "standing on", 1],
[3, "by", 2]
]
},
{
"objects": ["sky", "grass", "sheep", "sheep", "tree"],
"relationships": [
[0, "above", 1],
[2, "standing on", 1],
[3, "by", 2],
[4, "behind", 2]
]
},
{
"objects": ["sky", "grass", "sheep", "sheep", "tree", "ocean"],
"relationships": [
[0, "above", 1],
[2, "standing on", 1],
[3
, "by", 2],
[4, "behind", 2],
[5, "by", 4]
]
},
{
"objects": ["sky", "grass", "sheep", "sheep", "tree", "ocean", "boat"],
"relationships": [
[0, "above", 1],
[2, "standing on", 1],
[3, "by", 2],
[4, "behind", 2],
[5, "by", 4],
[6, "in", 5]
]
},
{
"objects": ["sky", "grass", "sheep", "sheep", "tree", "ocean", "boat"],
"relationships": [
[0, "above", 1],
[2, "standing on", 1],
[3, "by", 2],
[4, "behind", 2],
[5, "by", 4],
[6, "on", 1]
]
}
]
首先分析第一段:
{
"objects": ["sky", "grass", "zebra"],
"relationships": [
[0, "above", 1],
[2, "standing on", 1]
]
}
对象:sky [0]、grass [1]、zebra [2]
关系:sky [0] 在 grass [1] 的上面 ("above")
zebra [2] 站在 grass [1] 上 ("standing on")
也可以创建一段类似的新代码来测试一下刚刚的效果:
[{
"objects": ["sky", "grass", "dog", "cat", "tree", "ocean", "boat"],
"relationships": [
[0, "above", 1],
[2, "standing on", 1],
[3, "by"
, 2],
[4, "behind", 2],
[5, "by", 4],
[6, "on", 1]
]
}]
运行:
python scripts/run_model.py \
得到的图片是:
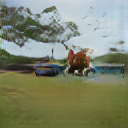
虽然看着有点奇怪,但是这个过程还是很有意思的。
TheAlgorithms/Python:
在Python中实现的所有算法
编程是数据科学中的必备技能,在这个伟大的知识资源库中,为大家介绍几个重要的算法实现。但是这些仅用于演示,由于性能的原因,在Python标准库中有许多更好的实现。
在Python标准库中你可以找到机器学习代码、神经网络、动态变成、排序、哈希等等。下面的代码教程是关于如何在 Python 中用 Numpy 从零开始构建 K-means。
'''README, Author - Anurag Kumar(mailto:anuragkumarak95@gmail.com)
Requirements:
- sklearn
- numpy
- matplotlib
Python:
- 3.5
Inputs:
- X , a 2D numpy array of features.
- k , number of clusters to create.
- initial_centroids , initial centroid values generated by utility function(mentioned in usage).
- maxiter , maximum number of iterations to process.
- heterogeneity , empty list that will be filled with hetrogeneity values if passed to kmeans func.
Usage:
1. define 'k' value, 'X' features array and 'hetrogeneity' empty list
2. create initial_centroids,
initial_centroids = get_initial_centroids(
X,
k,
seed=0 # seed value for initial centroid generation, None for randomness(default=None)
)
3. find centroids and clusters using kmeans function.
centroids, cluster_assignment = kmeans(
X,
k,
initial_centroids,
maxiter=400,
record_heterogeneity=heterogeneity,
verbose=True # whether to print logs in console or not.(default=False)
)
4. Plot the loss function, hetrogeneity values for every iteration saved in hetrogeneity list.
plot_heterogeneity(
heterogeneity,
k
)
5. Have fun..
'''
from __future__ import print_function
from sklearn.metrics import pairwise_distances
import numpy as np
TAG = 'K-MEANS-CLUST/ '
def get_initial_centroids(data, k, seed=None):
'''Randomly choose k data points as initial centroids'''
if seed is not None:
np.random.seed(seed)
n = data.shape[0]
rand_indices = np.random.randint(0, n, k)
centroids = data[rand_indices,:]
return centroids
def centroid_pairwise_dist(X,centroids):
return pairwise_distances(X,centroids,metric='euclidean')
def assign_clusters(data, centroids):
distances_from_centroids = centroid_pairwise_dist(data,centroids)
cluster_assignment = np.argmin(distances_from_centroids,axis=1)
return cluster_assignment
def revise_centroids(data, k, cluster_assignment):
new_centroids = []
for i in range(k):
member_data_points = data[cluster_assignment==i]
centroid = member_data_points.mean(axis=0)
new_centroids.append(centroid)
new_centroids = np.array(new_centroids)
return new_centroids
def compute_heterogeneity(data, k, centroids, cluster_assignment):
heterogeneity = 0.0
for i in range(k):
member_data_points = data[cluster_assignment==i, :]
if member_data_points.shape[0] > 0:
distances = pairwise_distances(member_data_points, [centroids[i]], metric='euclidean')
squared_distances = distances**2
heterogeneity += np.sum(squared_distances)
return heterogeneity
from matplotlib import pyplot as plt
def plot_heterogeneity(heterogeneity, k):
plt.figure(figsize=(7,4))
plt.plot(heterogeneity, linewidth=4)
plt.xlabel('# Iterations')
plt.ylabel('Heterogeneity')
plt.title('Heterogeneity of clustering over time, K={0:d}'.format(k))
plt.rcParams.update({'font.size': 16})
plt.show()
def kmeans(data, k, initial_centroids, maxiter=500, record_heterogeneity=None, verbose=False):
'''This function runs k-means on given data and initial set of centroids.
maxiter: maximum number of iterations to run.(default=500)
record_heterogeneity: (optional) a list, to store the history of heterogeneity as function of iterations
if None, do not store the history.
verbose: if True, print how many data points changed their cluster labels in each iteration'''
centroids = initial_centroids[:]
prev_cluster_assignment = None
for itr in range(maxiter):
if verbose:
print(itr, end='')
cluster_assignment = assign_clusters(data,centroids)
centroids = revise_centroids(data,k, cluster_assignment)
if prev_cluster_assignment is not None and \
(prev_cluster_assignment==cluster_assignment).all():
break
if prev_cluster_assignment is not None:
num_changed = np.sum(prev_cluster_assignment!=cluster_assignment)
if verbose:
print(' {0:5d} elements changed their cluster assignment.'.format(num_changed))
if record_heterogeneity is not None:
score = compute_heterogeneity(data,k,centroids,cluster_assignment)
record_heterogeneity.append(score)
prev_cluster_assignment = cluster_assignment[:]
return centroids, cluster_assignment
if False:
import sklearn.datasets as ds
dataset = ds.load_iris()
k = 3
heterogeneity = []
initial_centroids = get_initial_centroids(dataset['data'], k, seed=0)
centroids, cluster_assignment = kmeans(dataset['data'], k, initial_centroids, maxiter=400,
record_heterogeneity=heterogeneity, verbose=True)
plot_heterogeneity(heterogeneity, k)
GitHub 地址:https://github.com/TheAlgorithms
mlens :ML-Ensemble,
— 高性能集成学习
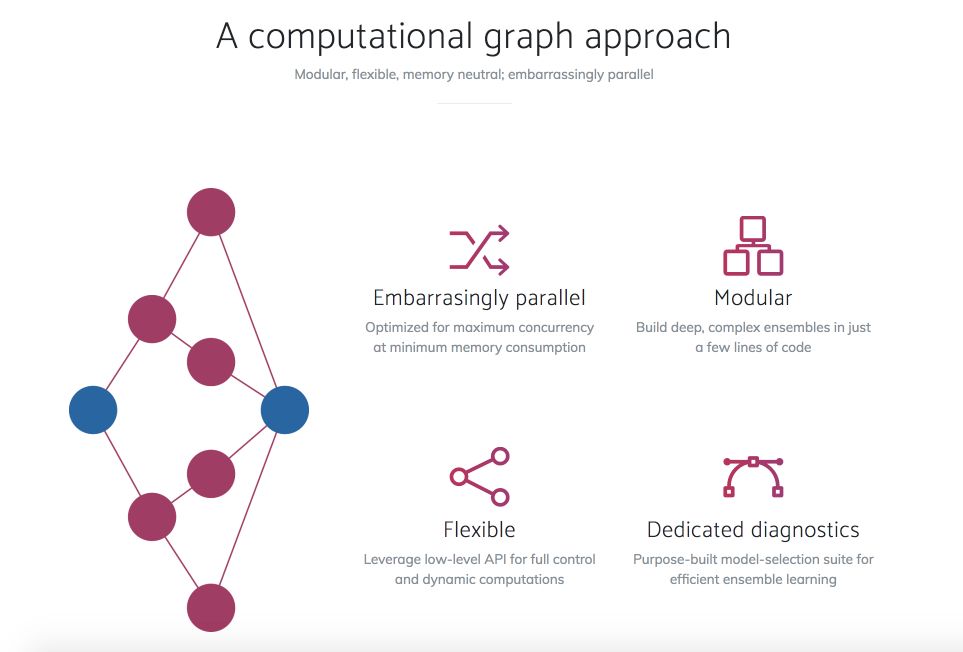
ML-Ensemble将Scikit-learn高级API与低级计算图框架结合在一起,以尽可能少的代码行构建高效、最大并行化的集成网络。只要基础学习者能够并且可以依靠内存映射的多处理来实现与内存无关的基于进程的并发,那么ML-Ensemble就是线程安全的。有关教程和完成的文档,请访问项目网站。
访问链接:
http://ml-ensemble.com/
GitHub 地址:
https://github.com/flennerhag/mlens
▌通过PyPI安装
ML-Ensemble 可在 PyPI 上使用。可以这样安装:
一个简单的示例(iris obligated示例):
import numpy as np
from pandas import DataFrame
from sklearn.metrics import accuracy_score
from sklearn.datasets import load_iris
seed = 2017
np.random.seed(seed)
data = load_iris()
idx = np.random.permutation(150)
X = data.data[idx]
y = data.target[idx]
from mlens.ensemble import SuperLearner
from sklearn.linear_model import LogisticRegression
from sklearn.ensemble import RandomForestClassifier
from sklearn.svm import SVC
ensemble = SuperLearner(scorer=accuracy_score, random_state=seed, verbose=2)
ensemble.add([RandomForestClassifier(random_state=seed), SVC()])
ensemble.add_meta(LogisticRegression())
ensemble.fit(X[:75], y[:75])
preds = ensemble.predict(X[75:])
将得到结果:
Fitting 2 layers
Processing layer-1             done | 00:00:00
Processing layer-2             done | 00:00:00
Fit complete                        | 00:00:00

Predicting 2 layers
Processing layer-1             done | 00:00:00
Processing layer-2             done | 00:00:00
Predict complete                    | 00:00:00
要检查图层中估算器的性能,需调用data属性。该属性可包装在pandas.DataFrame 中。
print("Fit data:\n%r" % ensemble.data)
结果
Fit data:
                                   score-m  score-s  ft-m  ft-s  pt-m  pt-s
layer-1  randomforestclassifier       0.84     0.06  0.05  0.00  0.00  0.00
layer-1  svc                          0.89     0.05  0.01  0.01  0.00  0.00
结果还不错,再看看整体表现:
这部分内容还有更详细的教程,大家可以访问下面的链接,学习更多。
更多内容可以参考:
http://ml-ensemble.com/info/tutorials/start.html
原文链接:
https://towardsdatascience.com/weekly-python-digest-for-data-science-1st-week-july-83bbf0355c36
pandas.DataFrame 参考链接:
http://pandas.pydata.org/pandas-docs/stable/generated/pandas.DataFrame.html#pandas.DataFrame
从利用场景图到图片生成这个有趣的过程,大家可以天马行空的去定义创造自己的图片;就算有有从零开始全部的 Coding 可以参考,也需要大家认知研究,从中有更多的收获。后续人工智能头条也还会继续努力为大家推荐更多有用、好用的实践教程。■
*本文由人工智能头条整理编译,转载请联系编辑(微信1092722531)
时间:7月17日 20:00-21:00
扫描海报二维码,免费报名
添加微信csdnai,备注:公开课,加入课程交流群

点击| 阅读原文 |免费报名