作者:赵相杰,中科院遗传与发育生物学研究所 生物信息学 研究生,xjzhao@genetics.ac.cn

很多时候不同的问题用各自适合的工具去解决会更舒服(比如一次性的数据处理工作交给shell,数据处理、机器学习交给Python,统计和可视化交给R)。 但是不同的语言有各自专用的IDE,比如python的Pycharm、Spyder等,R的Rstudio,在不同的IDE之间来回切换比较容易让人分心。 即使有jupyter notebook中irkernel,可以允许在jupyter notebook中创建以R为kernel的notebook,不同notebook间导出、导入仍然让我们很不爽。 我们需要一个可以在一个文件中写不同程序的方法。 这篇文章介绍了如何利用ipython的魔法方法在Python和R之间轻松切换
Warning: 个人认为该方法适合日使用频率 Python/R > 7/3的做数据分析的同学。比如日常工作是使用python做数据导入导出、数据处理和建模等,用R做统计和可视化,甚至部分统计和可视化也是由Python完成
Requirements:
conda: a package and environment manager
ipython: for interactive computing (using ipython magic method)
rpy2: a library for accessing R within Python
1. Installation
In temina
>conda create -n test python=3.7 ipython rpy2 simplegeneric pandas >conda activate test>ipython
# 在jupyter notebook/lab中或者ipython的交互式界面(jupyter notebook是加强版ipython,jupyter lab是jupyter notebook的加强版/未来版)# load ipython's rpy2 extension before calling rmagic methods%load_ext rpy2.ipython# %load_ext是ipython的魔法方法之一,调用后就可以用%%R或者%R写R code
2. R in ipython/jupyter
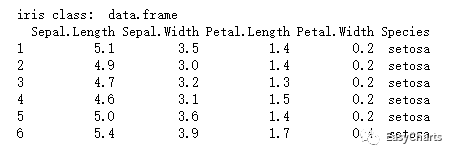
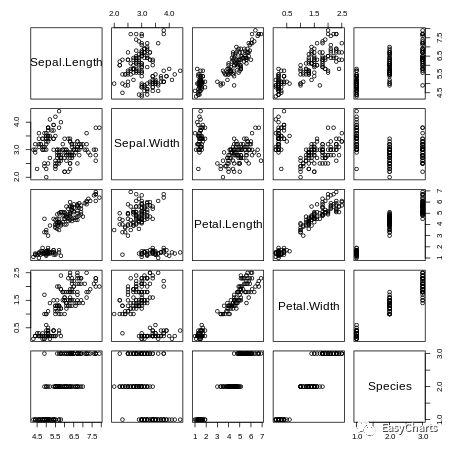
# ipython magic method for writing R code in a cell# %%R must be put in the fist line in a cell%%Rcat('iris class: ', class(iris), '\n')print(head(iris))plot(iris)
3. Communacating between Python and R
3.1 Python to R
import pandas as pd
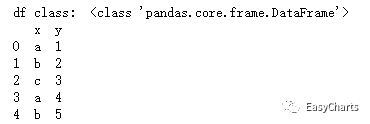
df = pd.DataFrame({'x':['a','b','c','a','b'],'y':[1,2,3,4,5]})print('df class: ', type(df))print(df)
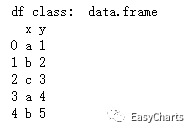
# pushing pandas dataframe into R dataframe%Rpush df
/home/xiangjie/programs/anaconda3/envs/py36/lib/python3.6/site-packages/rpy2/robjects/pandas2ri.py:191: FutureWarning: from_items is deprecated. Please use DataFrame.from_dict(dict(items), ...) instead. DataFrame.from_dict(OrderedDict(items)) may be used to preserve the key order.
  res = PandasDataFrame.from_items(items)
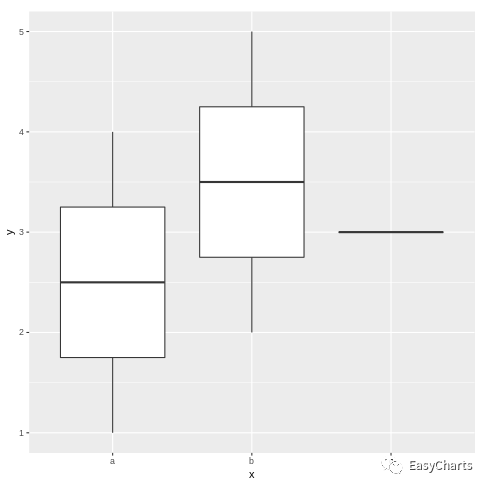
%%Rlibrary('ggplot2')
cat('df class: ', class(df), '\n')
print(head(df))(ggplot(df, aes(x,y)) + geom_boxplot())# ggsave('./test.pdf')
/home/xiangjie/programs/anaconda3/envs/py36/lib/python3.6/site-packages/rpy2/rinterface/__init__.py:146: RRuntimeWarning: Want to understand how all the pieces fit together? See the R for Data
Science book: http://r4ds.had.co.nz/

  warnings.warn(x, RRuntimeWarning)
3.2 R to Python
%%Rvec 1,2,3)cat('vec class:', class(vec), '\n')print(vec)
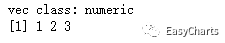
%Rpull vecvec_py = list(vec)print('vec class: ', type(vec_py))print(vec_py)
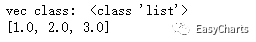
R to Python在数据形式复杂的时候比较麻烦,个人用的不多,具体可以查看rpy2的tutorial (见references)
In [11]:
## ipython还有很多魔法方法,其中比较常用的有!后直接跟shell命令来直接运行shell命令(比如!ls),%%time/%time来计算一段代码的运行时间等等
# %lsmagic  # 列出IPython的魔法方法
References:
rpy2: https://rpy2.readthedocs.io/en/version_2.8.x/
ipython rmagic extension: https://ipython.org/ipython-doc/2/config/extensions/rmagic.html
ipython rmagic extension: https://rpy2.github.io/doc/v2.9.x/html/interactive.html
ipykernel: https://ipython.readthedocs.io/en/stable/install/index.html

书籍推荐
《R数据可视化之美:专业图表绘制指南》以 R 语言为背景,通俗易懂地讲述了大量数据可视化领域的专业知识,从图形语法、色彩原理、视觉通道到各类图表的应用实践。
书籍配套开源R代码地址
https://github.com/EasyChart/Beautiful-Visualization-with-R

如需联系EasyCharts团队
请加微信:EasyCharts
【书籍推荐】
《Excel 数据之美--科学图表与商业图表的绘制》
【手册获取】国内首款-数据可视化参考手册:专业绘图必备
【必备插件】 EasyCharts -- Excel图表插件
【网易云课堂】 Excel 商业图表修炼秘笈之基础篇


