尽管已经有了scikit-learn、statsmodels、seaborn等非常优秀的数据建模库,但实际数据分析过程中常用到的一些功能场景仍然需要编写数十行以上的代码才能实现。
而今天要给大家推荐的dython就是一款集成了诸多实用功能的数据建模工具库,帮助我们更加高效地完成数据分析过程中的诸多任务:

通过下面两种方式均可完成对dython的安装:
pip install dython
或:
conda install -c conda-forge dython
dython中目前根据功能分类划分为以下几个子模块:
data_utils子模块集成了一些基础性的数据探索性分析相关的API,如identify_columns_with_na()可用于快速检查数据集中的缺失值情况:
>> df = pd.DataFrame({'col1': ['a', np.nan, 'a', 'a'], 'col2': [3, np.nan, 2, np.nan], 'col3': [1., 2., 3., 4.]})
>> identify_columns_with_na(df)
  column  na_count
1   col2         2
0   col1         1
identify_columns_by_type()可快速选择数据集中具有指定数据类型的字段:
>> df = pd.DataFrame({'col1': ['a', 'b', 'c'
, 'a'], 'col2': [3, 4, 2, 1], 'col3': [1., 2., 3., 4.]})
>> identify_columns_by_type(df, include=['int64', 'float64'])
['col2', 'col3']
one_hot_encode()可快速对数组进行「独热编码」:
>> one_hot_encode([1,0,5])
[[0. 1. 0. 0. 0. 0.]
 [1. 0. 0. 0. 0. 0.]
 [0. 0. 0. 0. 0. 1.]]
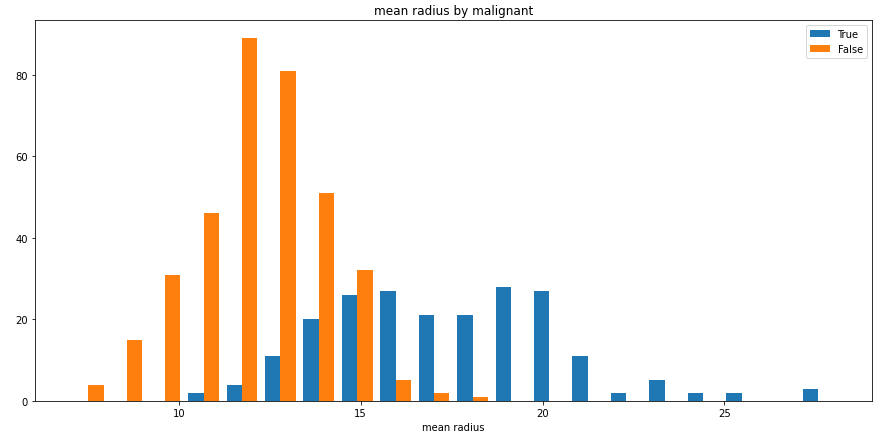
split_hist()则可以快速绘制分组直方图,帮助用户快速探索数据集特征分布:
import pandas as pd
from sklearn import datasets
from dython.data_utils import split_hist

# Load data and convert to DataFrame
data = datasets.load_breast_cancer()
df = pd.DataFrame(data=data.data, columns=data.feature_names)
df['malignant'] = [not bool(x) for x in data.target]

# Plot histogram
split_hist(df, 'mean radius', split_by='malignant', bins=20, figsize=(15,7))
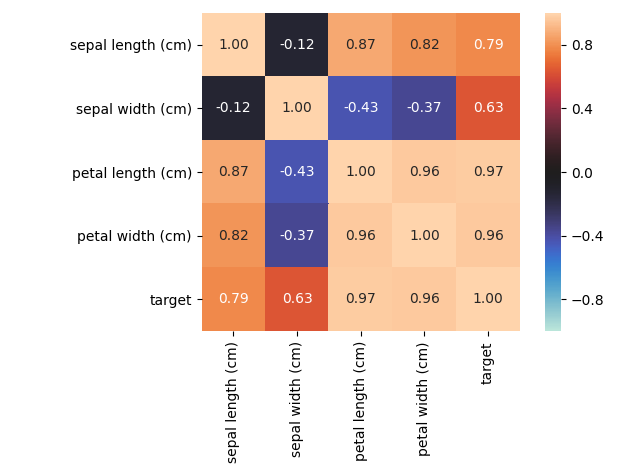
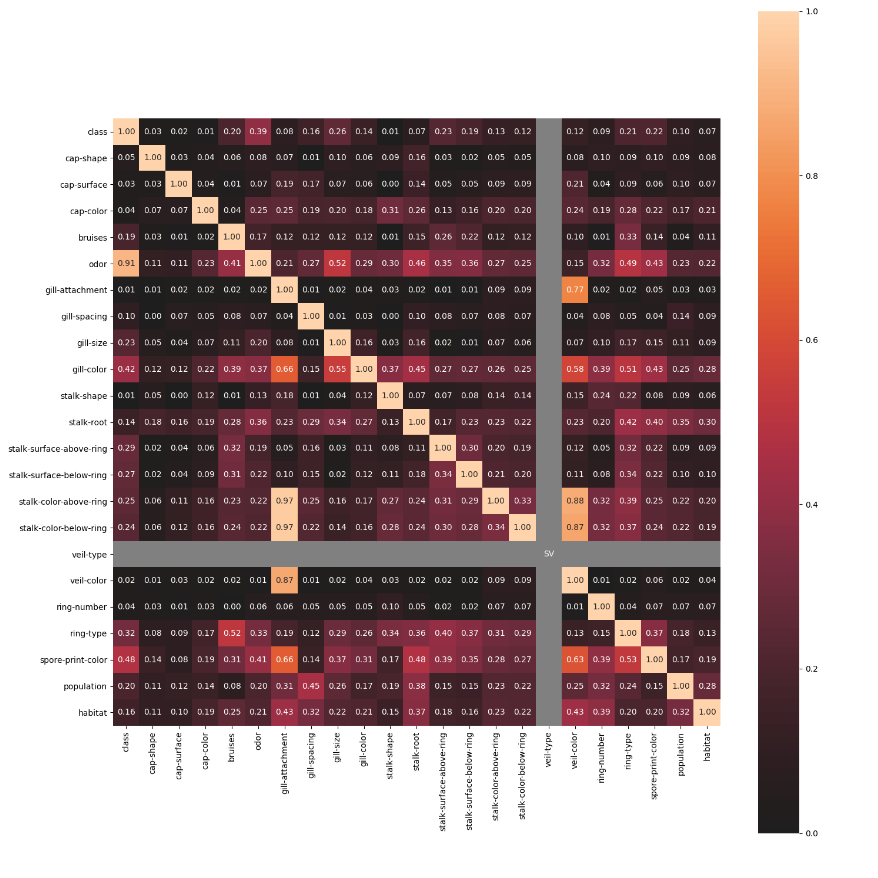
nominal子模块包含了一些进阶的特征相关性度量功能,例如其中的associations()可以自适应由连续型和类别型特征混合的数据集,并自动计算出相应的Pearson、Cramer's V、Theil's U、条件熵等多样化的系数;cluster_correlations()可以绘制出基于层次聚类的相关系数矩阵图等实用功能:
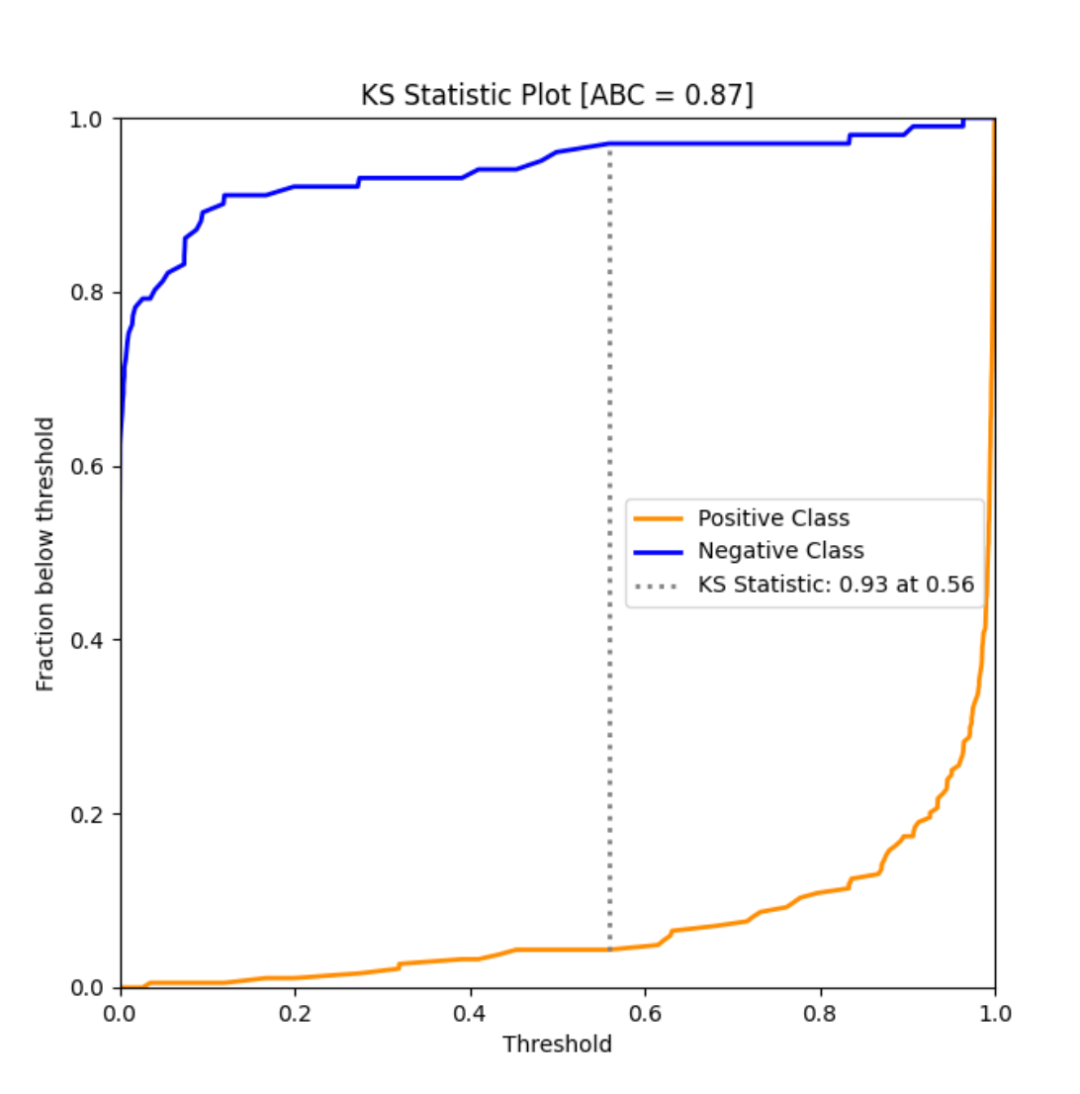
model_utils子模块包含了诸多对机器学习模型进行性能评估的工具,如ks_abc():
from sklearn import datasets
from sklearn.model_selection import train_test_split
from sklearn.linear_model import LogisticRegression
from dython.model_utils import ks_abc

# Load and split data
data = datasets.load_breast_cancer()
X_train, X_test, y_train, y_test = train_test_split(data.data, data.target, test_size=.5, random_state=0)

# Train model and predict
model = LogisticRegression(solver='liblinear')
model.fit(X_train, y_train)
y_pred = model.predict_proba(X_test)

# Perform KS test and compute area between curves
ks_abc(y_test, y_pred[:,1])
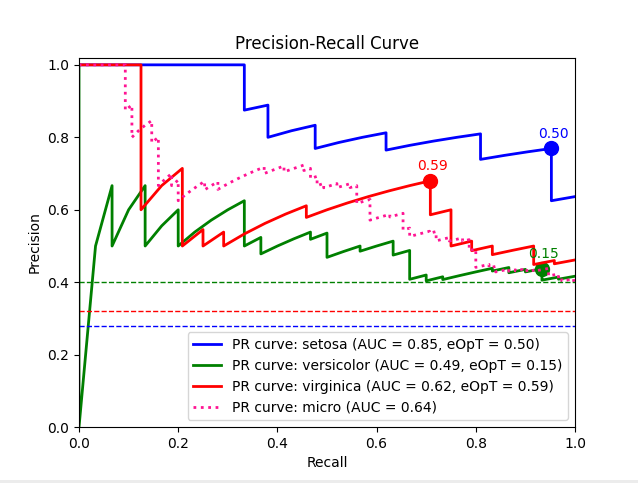
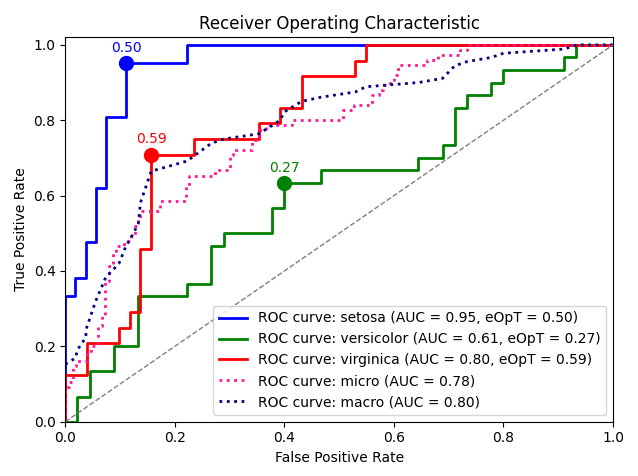
metric_graph():
import numpy as np
from sklearn import svm, datasets
from sklearn.model_selection import train_test_split
from sklearn.preprocessing import label_binarize
from sklearn.multiclass import OneVsRestClassifier
from dython.model_utils import metric_graph

# Load data
iris = datasets.load_iris()
X = iris.data
y = label_binarize(iris.target, classes=[0, 1, 2])

# Add noisy features
random_state = np.random.RandomState(4)
n_samples, n_features = X.shape
X = np.c_[X, random_state.randn(n_samples, 200 * n_features)]

# Train a model
X_train, X_test, y_train, y_test = train_test_split(X, y, test_size=.5, random_state=0)
classifier = OneVsRestClassifier(svm.SVC(kernel='linear', probability=True, random_state=0))

# Predict
y_score = classifier.fit(X_train, y_train).predict_proba(X_test)

# Plot ROC graphs
metric_graph(y_test, y_score, 'pr', class_names=iris.target_names)
import numpy as np
from sklearn import svm, datasets
from sklearn.model_selection import train_test_split
from sklearn.preprocessing import label_binarize
from sklearn.multiclass import OneVsRestClassifier
from dython.model_utils import metric_graph

# Load data
iris = datasets.load_iris()
X = iris.data
y = label_binarize(iris.target, classes=[0, 1, 2])

# Add noisy features
random_state = np.random.RandomState(4)
n_samples, n_features = X.shape
X = np.c_[X, random_state.randn(n_samples, 200 * n_features)]

# Train a model
X_train, X_test, y_train, y_test = train_test_split(X, y, test_size=.5, random_state=0)
classifier = OneVsRestClassifier(svm.SVC(kernel='linear', probability=True, random_state=0))

# Predict
y_score = classifier.fit(X_train, y_train).predict_proba(X_test)

# Plot ROC graphs
metric_graph(y_test, y_score, 'roc', class_names=iris.target_names)
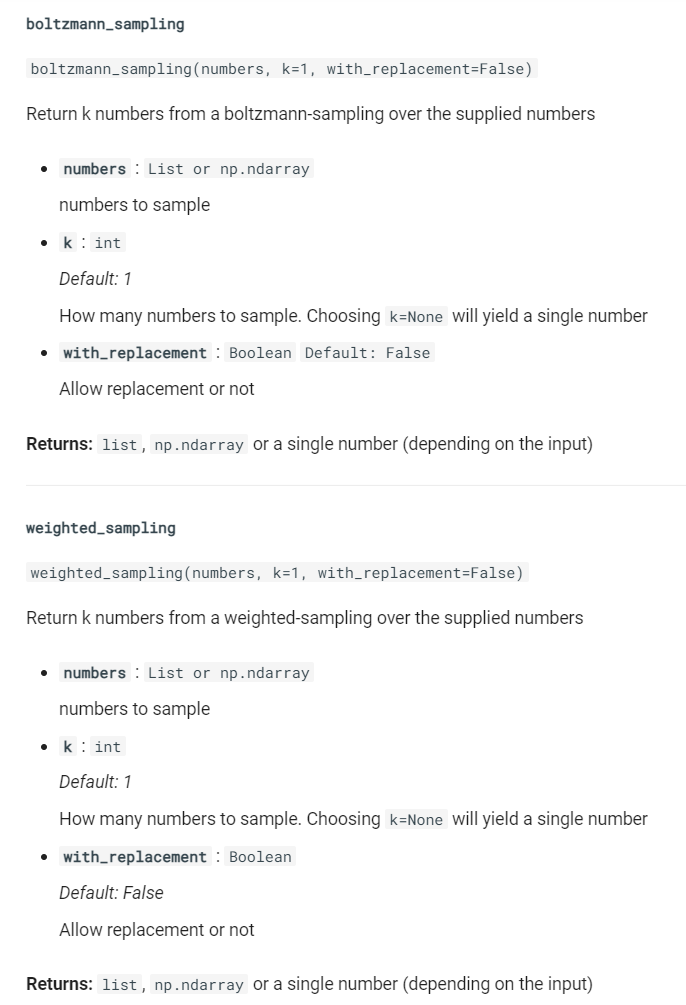
sampling子模块则包含了boltzmann_sampling()和weighted_sampling()两种数据采样方法,简化数据建模流程。
dython作为一个处于快速开发迭代过程的Python库,陆续会有更多的实用功能引入,感兴趣的朋友们可以前往https://github.com/shakedzy/dython查看更多内容或对此项目保持关注。
以上就是本文的全部内容,欢迎在评论区与我进行讨论~