本文来自光头哥哥的博客【Detecting multiple bright spots in an image with Python and OpenCV】,仅做学习分享。
原文链接:https://www.pyimagesearch.com/2016/10/31/detecting-multiple-bright-spots-in-an-image-with-python-and-opencv/
今天的博客文章是我几年前做的一个关于寻找图像中最亮点的教程的后续。
我之前的教程假设在图像中只有一个亮点你想要检测...
但如果有多个亮点呢?
如果您想在图像中检测多个亮点,代码会稍微复杂一点,但不会太复杂。不过不用担心:我将详细解释每一个步骤。
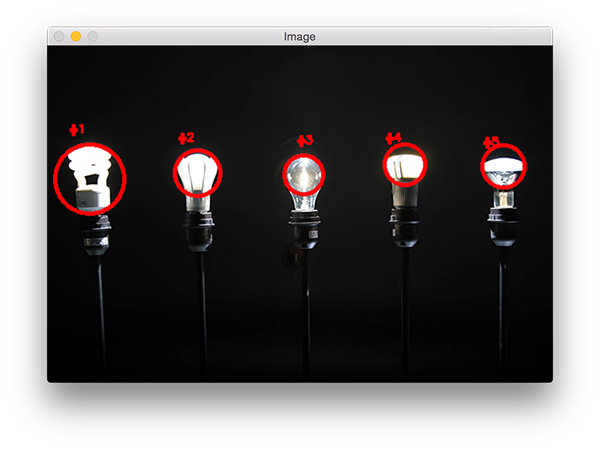
看看下面的图片:
在这幅图中,我们有五个灯泡。
我们的目标是检测图像中的这五个灯泡,并对它们进行唯一的标记。
首先,打开一个新文件并将其命名为detect_bright_spot .py。然后,插入以下代码:
from imutils import contoursfrom skimage import measureimport numpy as npimport argparseimport imutils
import cv2ap = argparse.ArgumentParser()ap.add_argument("-i", "--image", required=True, help="path to the image file")args = vars(ap.parse_args())
导入一些必要的包和命令行参数。
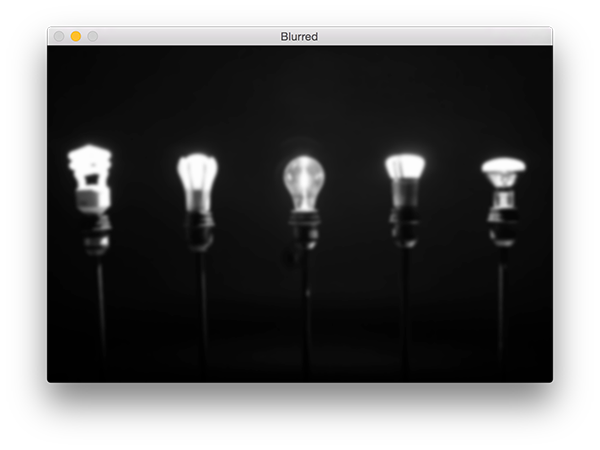
要开始检测图像中最亮的区域,我们首先需要从磁盘加载我们的图像,然后将其转换为灰度图并进行平滑滤波,以减少高频噪声:
image = cv2.imread(args["image"])gray = cv2.cvtColor(image, cv2.COLOR_BGR2GRAY)blurred = cv2.GaussianBlur(gray, (11, 11), 0)
这些操作的输出如下:
为了显示模糊图像中最亮的区域,我们需要应用阈值化:
thresh = cv2.threshold(blurred, 200, 255, cv2.THRESH_BINARY)[1]
操作取任意像素值p >= 200,并将其设置为255(白色)。像素值< 200被设置为0(黑色)。
阈值化后,我们得到如下图像:
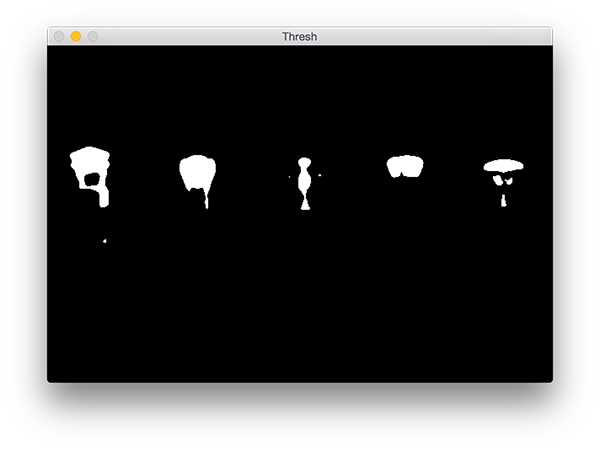
注意图像的明亮区域现在都是白色的,而其余的图像被设置为黑色。
然而,在这幅图像中有一点噪声(即,小斑点),所以让我们通过执行一系列的腐蚀和膨胀操作来清除它:
thresh = cv2.erode(thresh, None, iterations=2)thresh = cv2.dilate(thresh, None, iterations=4)
在应用这些操作之后,你可以看到我们的thresh图像变得更加“干净”,但是仍然有一些我们想要移除的斑点。
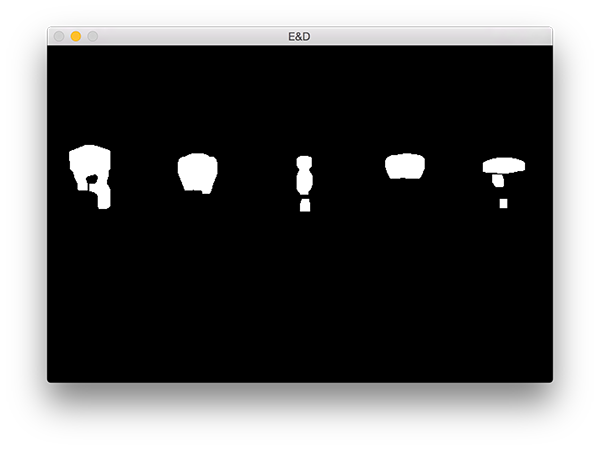
本项目的关键步骤是对上图中的每个区域进行标记,然而,即使在应用了腐蚀和膨胀后,我们仍然想要过滤掉剩余的小块儿区域。
一个很好的方法是执行连接组件分析:
labels = measure.label(thresh, neighbors=8, background=0)mask = np.zeros(thresh.shape, dtype="uint8")for label in np.unique(labels): if label == 0: continue labelMask = np.zeros(thresh.shape, dtype="uint8") labelMask[labels == label] = 255 numPixels = cv2.countNonZero(labelMask) if numPixels > 300: mask = cv2.add(mask, labelMask)
第4行使用scikit-image库执行实际的连接组件分析。measure.lable返回的label和我们的阈值图像有相同的大小,唯一的区别就是label存储的为阈值图像每一斑点对应的正整数。
然后我们在第5行初始化一个掩膜来存储大的斑点。
第7行我们开始循环遍历每个label中的正整数标签,如果标签为零,则表示我们正在检测背景并可以安全的忽略它(9,10行)。
否则,我们为当前区域构建一个掩码。
下面我提供了一个GIF动画,它可视化地构建了每个标签的labelMask。使用这个动画来帮助你了解如何访问和显示每个单独的组件:

然后第15行对labelMask中的非零像素进行计数。如果numPixels超过了一个预先定义的阈值(在本例中,总数为300像素),那么我们认为这个斑点“足够大”,并将其添加到掩膜中。
输出掩模如下图:
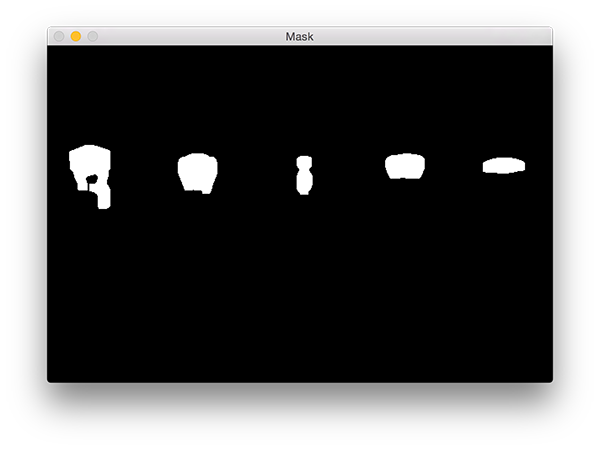
注意,所有小的斑点都被过滤掉了,只有大的斑点被保留了下来。
最后一步是在我们的图像上绘制标记的斑点:
cnts = cv2.findContours(mask.copy(), cv2.RETR_EXTERNAL, cv2.CHAIN_APPROX_SIMPLE)cnts = imutils.grab_contours(cnts)cnts = contours.sort_contours(cnts)[0]for (i, c) in enumerate(cnts): (x, y, w, h) = cv2.boundingRect(c) ((cX, cY), radius) = cv2.minEnclosingCircle(c) cv2.circle(image, (int(cX), int(cY)), int(radius), (0, 0, 255), 3) cv2.putText(image, "#{}".format(i + 1), (x, y - 15), cv2.FONT_HERSHEY_SIMPLEX, 0.45, (0, 0, 255), 2)cv2.imshow("Image", image)cv2.waitKey(0)首先,我们需要检测掩模图像中的轮廓,然后按从左到右排序(3-7行)。
一旦我们的轮廓已经排序,我们可以对它们进行单独的循环处理(第8行)。
对于这些轮廓线,我们将计算出代表明亮区域的最小包围圆(第12行)。
然后,我们唯一地标记该区域并在图像上绘制它(第12-15行)。
最后,第17行和第18行显示了输出结果。
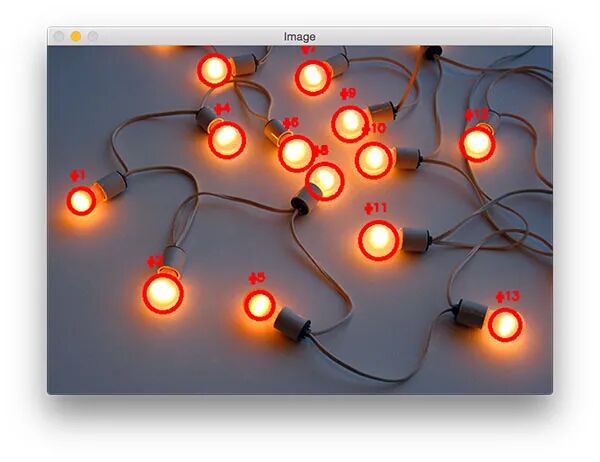
运行程序,你应该会看到以下输出图像:
请注意,每个灯泡都被独特地标上了圆圈,圆圈围绕着每个单独的明亮区域。