👇点击关注公众号👇
第一时间获取人工智能干货内容
本篇继续回归分析实战。
导入数据:
import pandas
df = pandas.read_excel(r'D:\机器学习数据\house_price_regression.xlsx')
df.head()
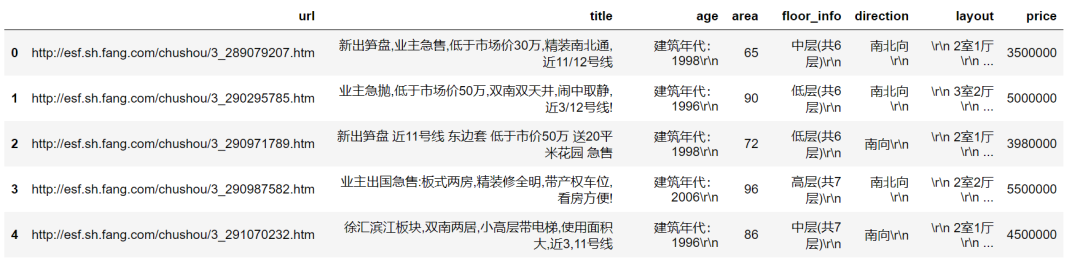
房屋数据预处理:
df['age'] = df['age'].map(lambda e: 2017 - int(e.strip().strip('建筑年代:')) )#作差计算age
df[['room', 'living_room']] = df['layout'].str.extract('(\d+)室(\d+)厅')#将房间情况分开
df['room'] = df['room'].astype(int)#将房间数量转为整数型
df['living_room'] = df['living_room'].astype(int)
df['total_floor'] = df['floor_info'].str.extract('共(\d+)层')#提取层数
df['total_floor'] = df['total_floor'].astype(int)
df['floor']       = df['floor_info'].str.extract('^(.)层')#^表示从开头匹配
df['direction']   = df['direction'].map(lambda e: e.strip())#去空格
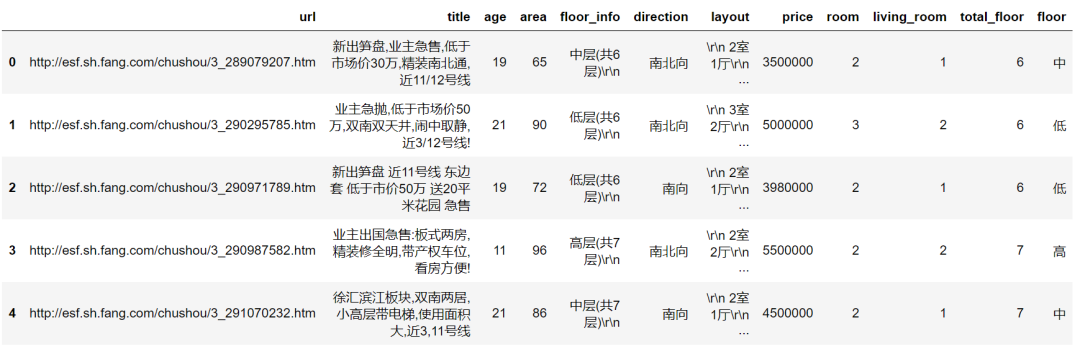
查看处理后的数据:
删除多余重复的列:
#提取完必要信息后可删除原栏位
del df['layout']
del df['floor_info']
del df['title']
del df['url']
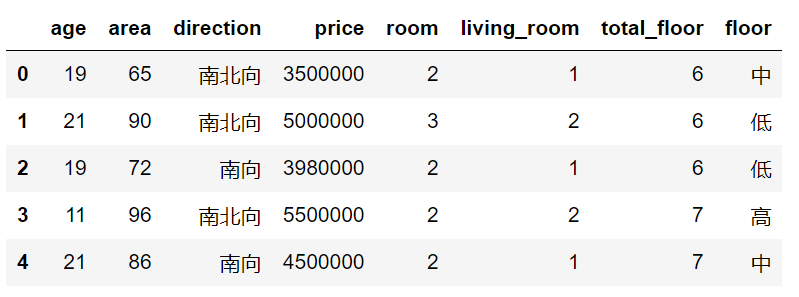
查看最新数据:
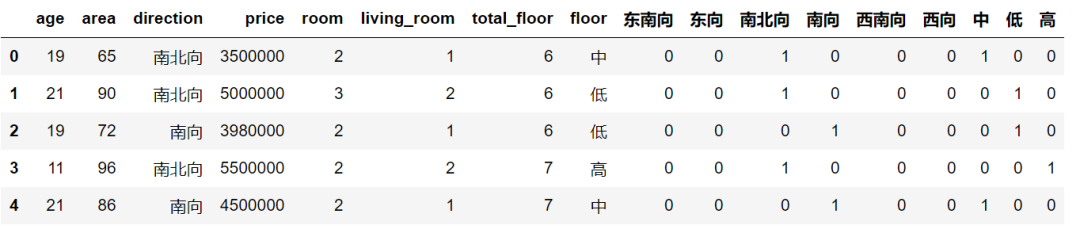
建立虚拟变量:
df = pandas.concat([df, pandas.get_dummies(df['direction']), pandas.get_dummies(df['floor'])], axis = 1 ) #建立虚拟变量
删除重复多余列:
del df['南北向']
del df['低']
del df['direction']
del df['floor']
绘制散点图:
%matplotlib inline
df[['price', 'area']].plot(kind='scatter', x = 'area', y = 'price', figsize=[10,5])
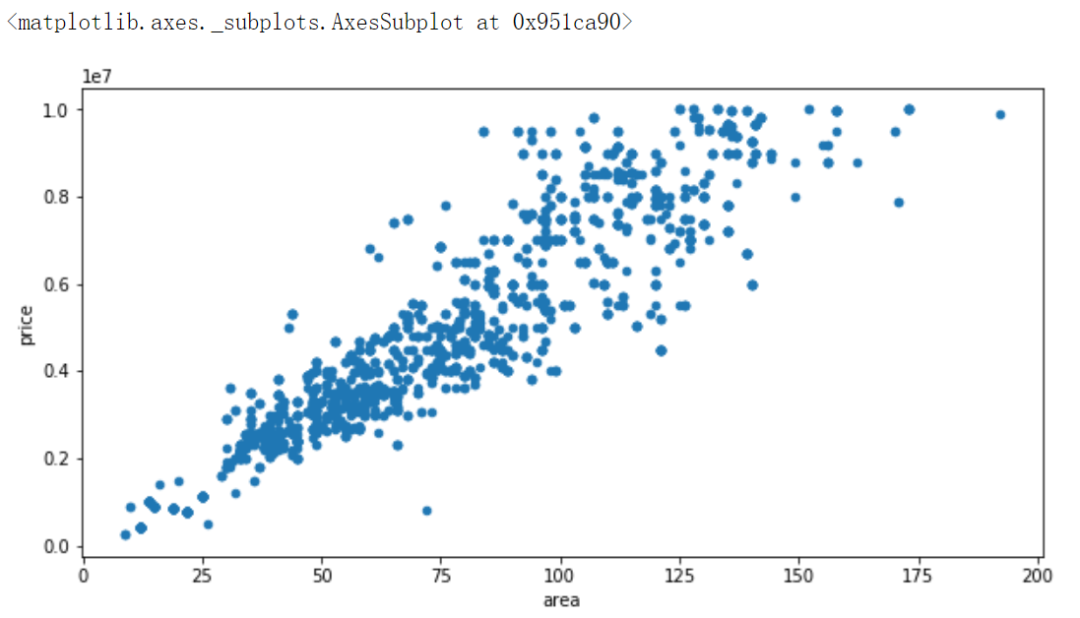
分析房价与房屋面积关系:
y= df['price']
X = df[['area']]
建模:
from sklearn.linear_model import LinearRegression
regr = LinearRegression()
regr.fit(X,y)

查看系数和截距:
print('Coefficient:{}'.format(regr.coef_) )
print('Intercept:{}'.format(regr.intercept_) )

绘图:
import matplotlib.pyplot as plt
plt.scatter(X,y, color="blue")
plt.plot(X, regr.predict(X), linewidth = 3, color = "red")
plt.xlabel('area')
plt.ylabel('price')
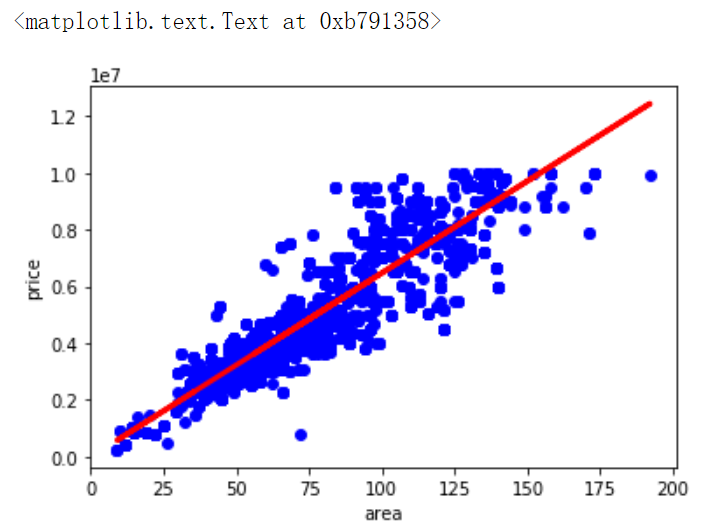
红色为回归的结果曲线。
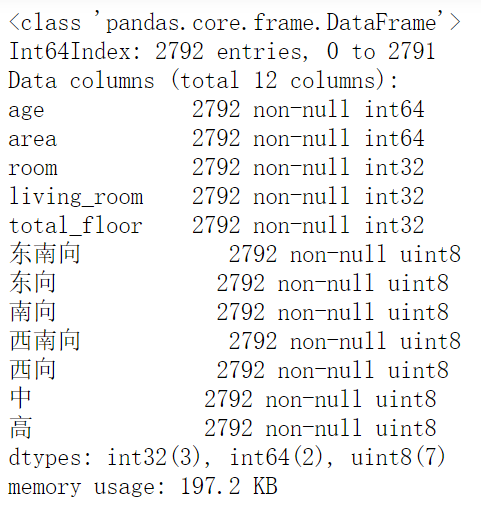
接下来进行多元回归:
选择部分变量:
y= df['price'].values
X = df[['age', 'area', 'room', 'living_room', 'total_floor', '东南向', '东向', '南向', '西南向', '西向', '中', '高']]
导入模型建模:
from sklearn.linear_model import LinearRegression
regr = LinearRegression()
regr.fit(X,y)

评估模型:
import statsmodels.api as sm
X2 = sm.add_constant(X)
est = sm.OLS(y, X2)
est2 = est.fit()
print(est2.summary())
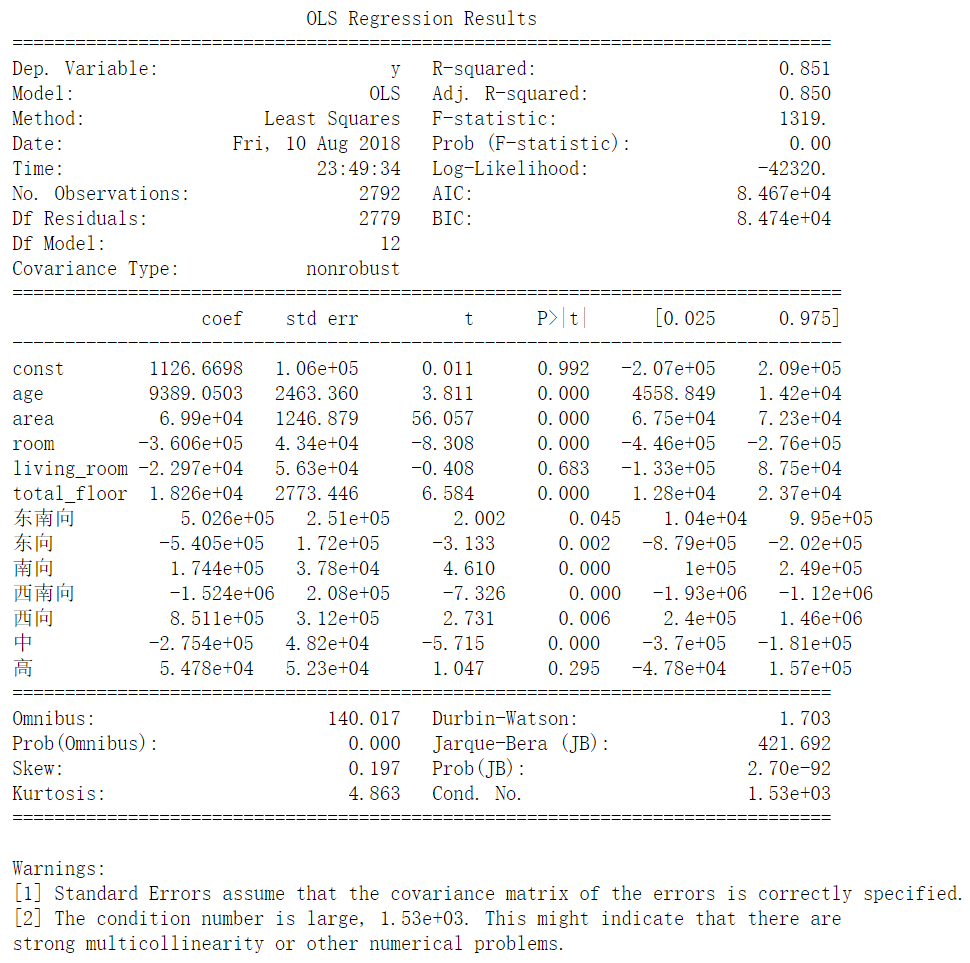
根据AIC值选择最佳参数组合(通常AIC越小越好)
predictorcols = ['age', 'area', 'room', 'living_room', 'total_floor', '东南向', '东向', '南向', '西南向', '西向', '中', '高']
import itertools
AICs = {}
for k in range(1,len(predictorcols)+1):
    for variables in itertools.combinations(predictorcols, k):
        predictors  = X[list(variables)]
        predictors2 = sm.add_constant(predictors)
        est = sm.OLS(y, predictors2)
        res = est.fit()
        AICs[variables] = res.aic
from collections import Counter
c = Counter(AICs)
c.most_common()[::-10]
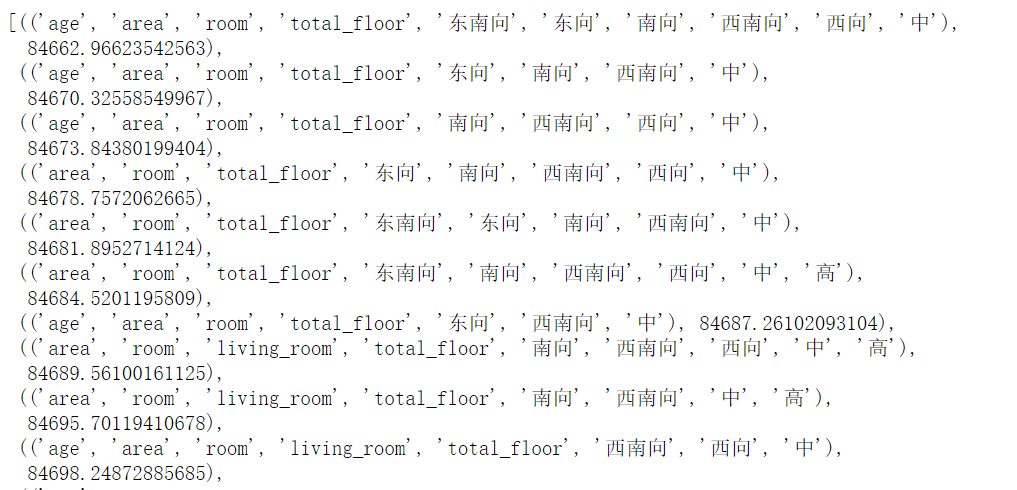
这就选出了和房价相关的变量。
这就是回归分析实战,你学会了么?