雷达外推grb2文件的解析绘图python和meteoinfolab的对比总结:1、python与meteoinfoLab的主要函数是差不多的,colorbar这块的设计meteoinfoLab还是更加的清晰一些。python的绘图库matplotlib,实现过于复杂。
2、meteoinfoLab颜色值中的数值必须是从小到大,其规则如下。如值为[15,20,25,...,70],第一个颜色表示小于等于15的,第二个颜色表示(15,20]。所以meteoinfo中的颜色值需要添加一位(255,255,255)。3、数据解析出来的变量meteoinfoLab多了下划线需要注意。Layer-maximum_base_reflectivity_surface4、代码量和代码的简洁清晰上来看,meteoinfoLab也是优于python的。就是meteoinfoLab用的人比较少,成熟度和认可度低于python。f = addfile(u'/Users/Downloads/8257226c06da73c063b315c41821c9fc.grib2')
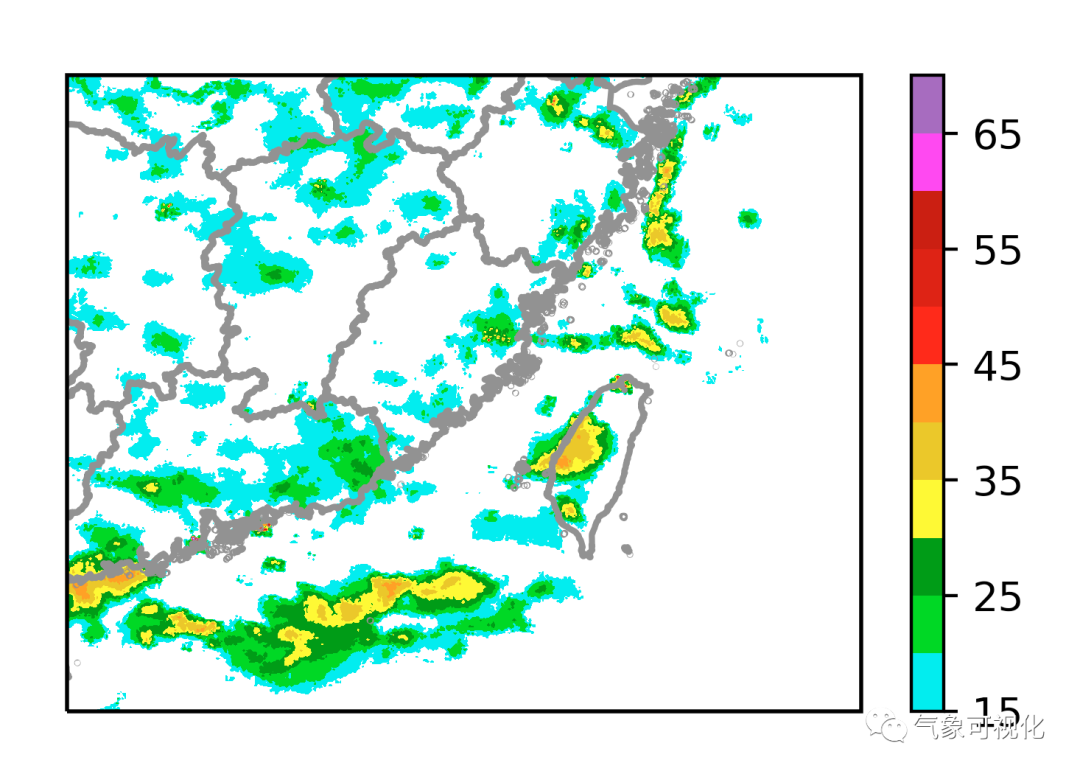
data = f['Layer-maximum_base_reflectivity_surface'][0]
t = f.gettime(0)
axesm(projinfo=f.proj)
lstates = shaperead(u'cn_province.shp')
cols=[(255,255,255),(0,236,236),(0,216,0),(1,144,0),(255
,255,0),(231,192,0),(255,144,0),
(255,0,0),(214,0,0),(192,0,0),(255,0,240),(150,80,180)
]
levs=[15, 20, 25, 30, 35, 40, 45, 50, 55, 60, 65, 70]
#layer = imshowm(data, 20, proj=f.proj, order=1)
layer = contourfm(data,levs,colors=cols)
colorbar(layer)
geoshow(lstates, edgecolor='k')
xlim(111.0, 125.97000000000057)
ylim(19.0, 30.970000000000454)
title('Base reflectivity (' + t.strftime('%Y-%m-%d %H:%M') + ')')
import pygrib as pg
import numpy as np
import matplotlib.pyplot as plt
import matplotlib.colors as clr
import cartopy.crs as ccrs
import cartopy.io.shapereader
grbs = pg.open(u'/Users/Downloads/8257226c06da73c063b315c41821c9fc.grib2')
grbs.seek(0) # 指定指针
for grb in grbs: # 看看里面有几组数据
print(grb)
# 1:Total precipitation:kg m-2 (instant):regular_ll:surface:level 0:fcst time 0 hrs:from 202108020306
# 2:Layer-maximum base reflectivity:dB (instant):regular_ll:surface:level 0:fcst time 0 hrs:from 202108020306
# 选择并提取出对应的变量名称
grb = grbs.select(name='Layer-maximum base reflectivity')[0]
# grb = grbs.message(2) # get the second grib message
lat, lon = grb.latlons()
print(grb.keys())
box = [lon.min(), lon.max(), lat.min(), lat.max()]
values = grb.values
fig = plt.figure(figsize=[6.4, 4.8], dpi=200)
ax = plt.axes(projection=ccrs.PlateCarree())
cmap = clr.ListedColormap(["#00ECEC", "#00D800",
"#019000", "#FFFF00", "#E7C000",
"#FF9000", "#FF0000", "#D60000",
"#C00000", "#FF00F0", "#9650B4"
])
cmap.set_over((0.001462, 0.000466, 0.013866, 1))
cmap.set_under((1
, 1, 1, 0))
color_lev = np.array([15, 20, 25, 30, 35, 40, 45, 50, 55, 60, 65, 70])
ax.background_patch.set_visible(False)
ax.outline_patch.set_visible(True)
filled_c=ax.contourf(lon, lat, values, transform=ccrs.PlateCarree(),
cmap=cmap, levels=color_lev)
# Use the line contours to place contour labels.
fig.colorbar(filled_c, orientation='horizontal')
shp_file = "/Users/Desktop/MeteoInfo/map/cn_province.shp"
reader = cartopy.io.shapereader.Reader(shp_file)
geometries = reader.geometries()
ax.add_geometries(geometries, crs=ccrs.PlateCarree(),
linestyle='-',
facecolor='none',
edgecolor='grey', linewidth=1.5)
ax.set_extent(box)
plt.show()
加我微信请务必备注一下姓名+职业,名额有限。等微信号满了,就需要付费才能加我好友。


